Stakeholder Mapping: Methods, Examples and a Free Template

Stakeholder mapping is the process of identifying the people and organisations affected by, or able to influence, a project, then assessing each one against criteria such as influence, interest and impact. The result is a visual map that shows who to engage, how and when, and it guides your engagement plan and reporting.
What is stakeholder mapping?
Stakeholder mapping turns a list of names into a picture of your project’s relationships. You identify stakeholders, assess each one against a consistent set of criteria, and plot the results so you can see who matters most, where support or opposition sits, and where to focus your effort.
It sits between stakeholder identification and your engagement plan. Identification tells you who. Mapping tells you how much each one matters and why. The engagement plan tells you what you’ll do about it.
Why stakeholder mapping matters
- It focuses limited time. Most projects have more stakeholders than they can engage deeply. A map shows where effort changes outcomes.
- It surfaces risk early. Highly affected, low-support stakeholders are visible before they become a complaint, a media story or a planning objection.
- It makes engagement defensible. Regulators, boards and funders increasingly expect evidence of how stakeholders were prioritised.
- It aligns the team. One shared map means project, community and government relations teams work from the same picture.
How to do stakeholder mapping in 6 steps
- Identify your stakeholders. List every individual, group and organisation affected by or able to influence the project. Include internal stakeholders, landholders, community groups, Traditional Owners, regulators, elected representatives and media.
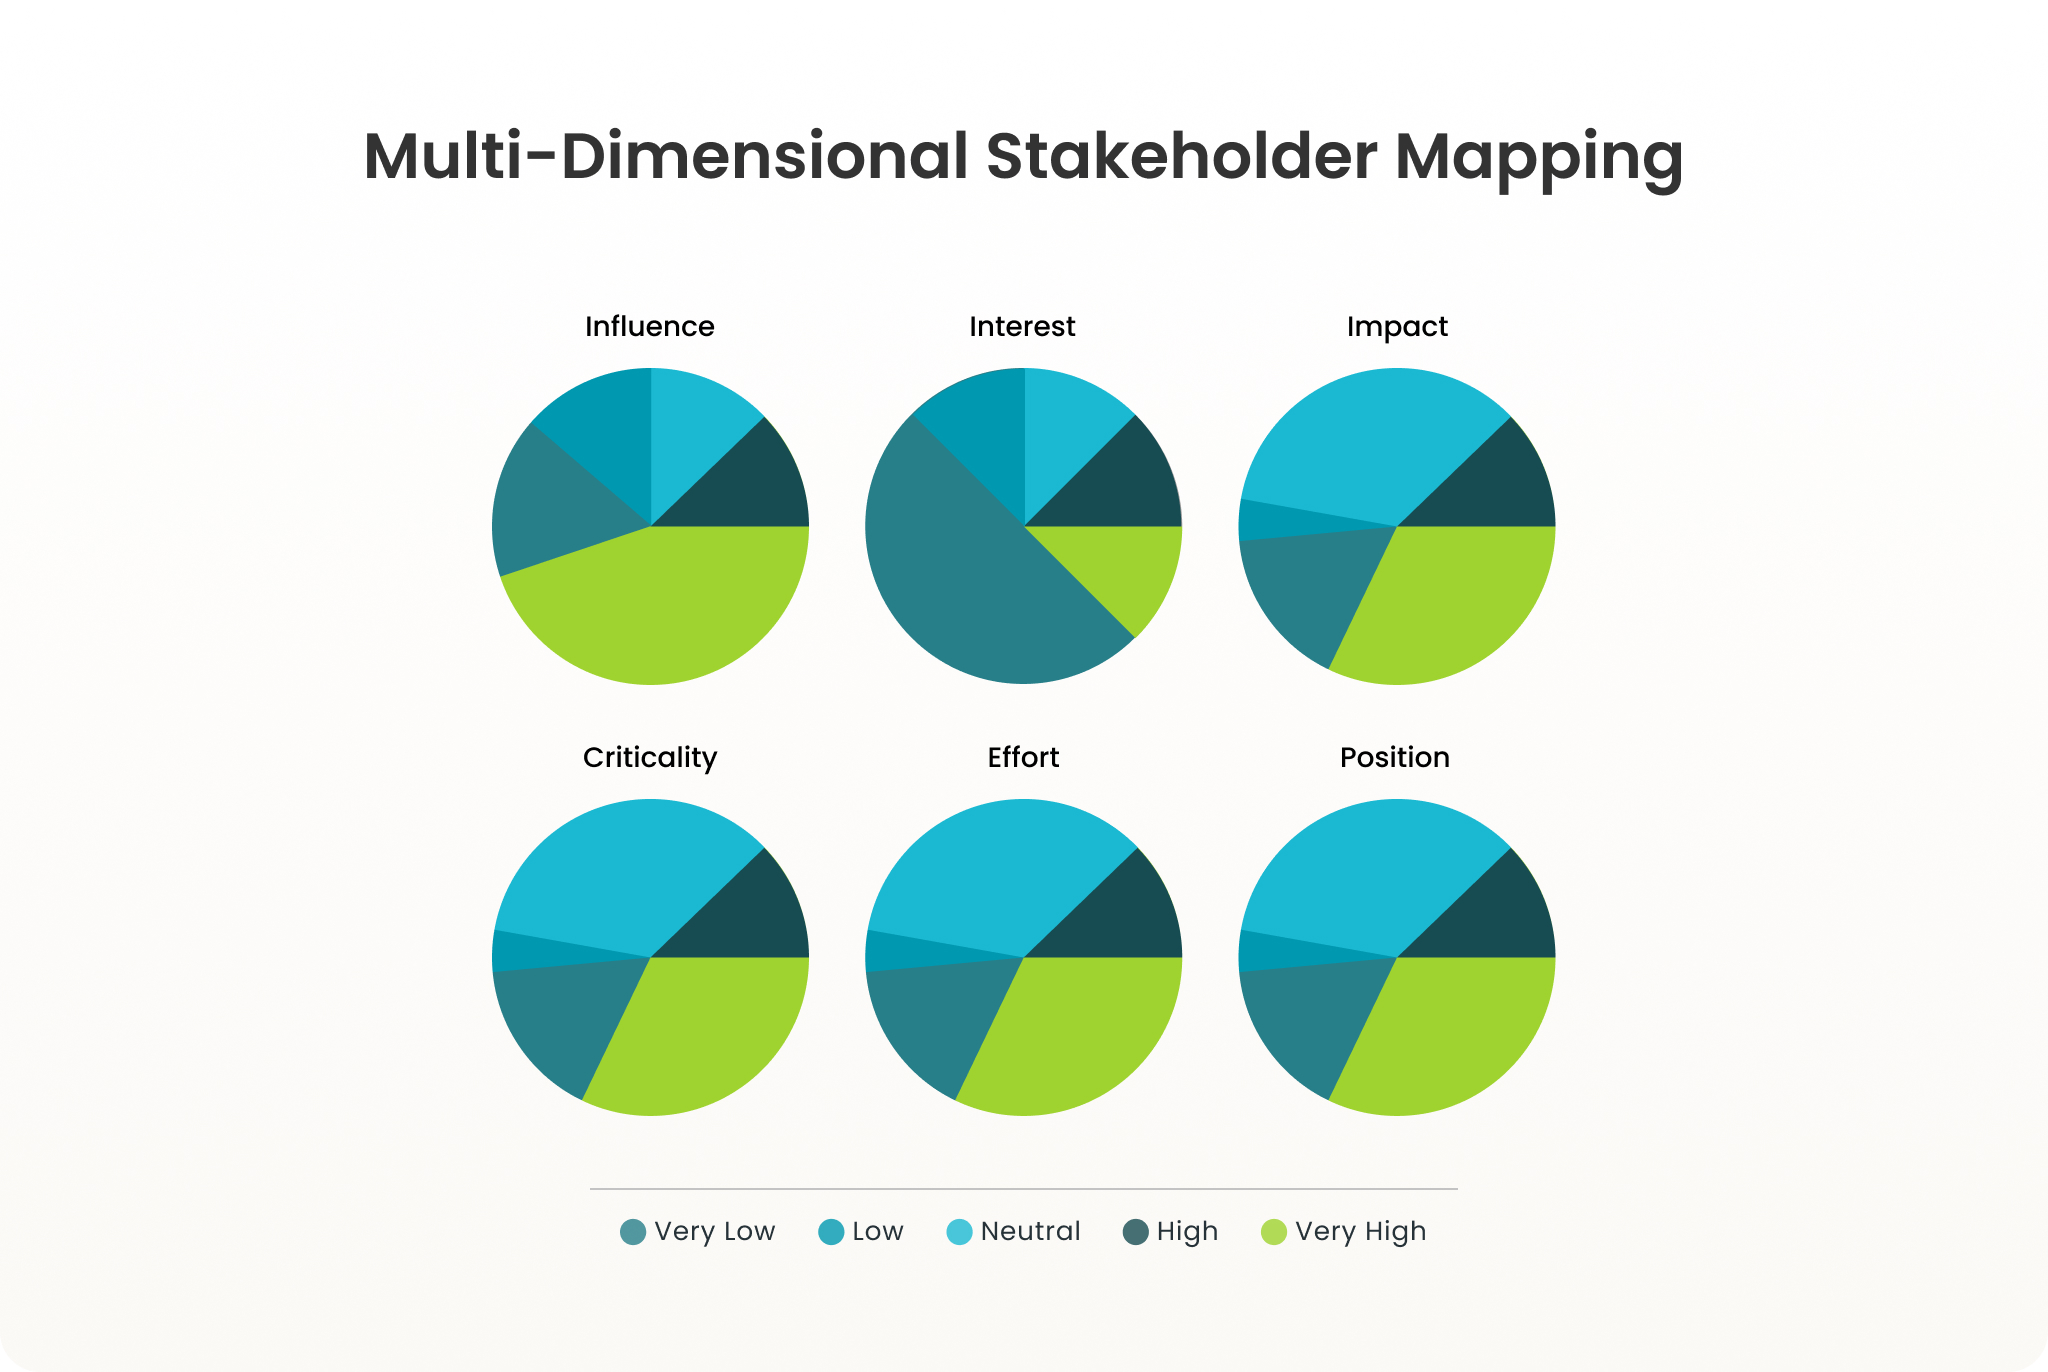
- Choose your criteria. Decide what you’ll assess each stakeholder on. We recommend six: influence, interest, impact, criticality, effort and position.
- Score each stakeholder. Rate each one against every criterion on a consistent scale (for example 1–5). Record why, so the score can be challenged and updated.
- Visualise the map. Plot stakeholders on a scatter chart (for example influence against impact) and colour by position, so priority and sentiment show at a glance.
- Set engagement approaches. Use the map to decide the level of engagement for each stakeholder or group, from inform through to collaborate on the IAP2 Spectrum of Public Participation.
- Review it regularly. Stakeholders’ positions change. Re-score after key milestones, meetings and issues, not just at project start.
Free stakeholder mapping template
A six-criteria scoring sheet for Excel and Google Sheets. Add your stakeholders, score them, and the map and top-10 priority list build themselves.
Stakeholder mapping methods compared
| Method | What it shows | Best for | Main limitation |
|---|---|---|---|
| Power/interest grid | Stakeholders in 4 quadrants by power and interest | Quick first sort on small projects | Two dimensions hide impact, sentiment and change over time |
| Salience model (Mitchell, Agle & Wood) | Power, legitimacy and urgency as overlapping circles | Deciding whose claims need attention now | Hard to score consistently; no view of sentiment |
| Power-predictability matrix | How powerful and how predictable each stakeholder is | Spotting volatile, high-power stakeholders | Ignores how affected stakeholders are |
| Stakeholder knowledge base chart | Awareness against support | Planning communication campaigns | Doesn’t show influence or impact |
| Relationship (network) mapping | Who is connected to whom | Finding influencers and indirect routes to key people | Shows connections, not priority |
| Six-criteria mapping | Influence, interest, impact, criticality, effort and position | Complex projects with many stakeholders and long timeframes | Needs consistent scoring, easiest in software |
Why the power/interest grid falls short
The power/interest grid is the most widely taught model, and the one we least recommend relying on. It reduces each stakeholder to two scores, then sorts them into four boxes such as “keep satisfied” and “monitor”. That loses three things that matter most on real projects:
- Impact. A landholder with little formal power but heavy exposure to your project can stall it.
- Position. Two stakeholders in the same quadrant can be a supporter and an opponent.
- Change. A static grid can’t show a stakeholder moving from neutral to opposed after a poorly handled meeting.
It also treats “interest” as how interested someone is in your work. What matters more is whether they have a legitimate right to be consulted.
A better approach: six-criteria stakeholder mapping
Six-criteria mapping assesses every stakeholder on:
| Criterion | Question it answers |
|---|---|
| Influence | How much can they shape decisions or outcomes? |
| Interest | Do they have a cultural, social or economic right to be consulted? |
| Impact | How much will the project affect them? |
| Criticality | How important are they to the project’s success? |
| Effort | How much engagement effort will they need? |
| Position | Do they support, oppose or sit neutral? |
You can then view the map through any pair of criteria (for example impact against influence, coloured by position) instead of being locked into one grid. Tracked over time, the scores show whether engagement is moving stakeholders in the right direction.
Stakeholder mapping examples
Example 1: Offshore wind project

A large energy company was preparing to develop an offshore wind farm, with around 30 turbines, situated some 20 km off the coast of a popular beachside suburb. In order to proceed with project planning and development, they needed to consult with stakeholders. These include regulatory agencies, politicians, fishing groups, tourism groups, local commerce chambers, environmental groups, residents, and regular visitors to the beach.
To better understand how each stakeholder group might be best consulted and engaged, they used several stakeholder mapping methods:
- Multi-dimensional stakeholder maps: Mapping the interest, impact, influence, criticality, position, and effort of all stakeholder groups and individuals
- Geographical mapping: Visualizing all stakeholders, their primary activities, and the project on a location map
- Stakeholder relationship network maps: Visualizing and tracking the relationships between the company and stakeholders, as well as relationships between stakeholder groups via network mapping
The stakeholder mapping process enabled the following outcomes:
- Supporting the energy company to meet their stakeholder consulting obligations and deliver a better project overall
- Categorizing stakeholders to provide a tailored messaging and engagement approach
- Gaining more detailed insights into the local area, informing the location and timing of the project
- Prioritizing key players based on the anticipated impact of the project
- Strategically building new relationships via existing contacts, and tracking the strength of these relationships, along with their impact on support for the project
See how a wind energy developer manages this in practice: read the wind farm case study.
Example 2: Transmission line route selection
Landholders along candidate corridors score high on impact and interest: they have a clear economic and often cultural right to be consulted. Individually, though, they tend to score low on influence. Mapped as a group, alongside local councils and farming bodies, they become the highest-priority cluster. That shifts engagement from information sessions to one-to-one landholder conversations early in route selection.
Example 3: New health facility

A large private health services company was planning to build a large, new medical facility in an urban area that was underserved by existing services. They anticipated that this facility would provide spaces for specialists to consult with patients, as well as a pharmacy, GP clinic, and a private day hospital for minor procedures. In order to understand the potential demand for and impact of the new proposed facility, they needed to engage with external stakeholders.
With so many varying stakeholder groups, it was important to undertake stakeholder mapping in a way that supported effective stakeholder management. Methods used included:
- Multi-dimensional stakeholder maps: They determined the interests/impacts/influence/criticality/position/effort of each group or individual, using this to identify key groups to engage with sooner or more frequently
- Power/Interest Grid: They helped to confirm prioritization for engagement, while understanding who might only need to be kept informed vs actively engaged
The stakeholder mapping process enabled the following outcomes for the business:
- Planning the engagement efficiently, allowing them to get valuable input on the new development early on in the process
- Gaining insights that helped to shape key decisions like confirming what type of facilities might be needed, the types of specialists most in demand, and the size of the facility (accounting for future growth)
- Designing features to minimize negative impacts on surrounding residents and businesses (such as a large underground parking area with access on two streets)
- Building relationships with stakeholders who would one day occupy a space in the facility, allowing them to get involved in the construction process and help to shape their future premises
See six-criteria mapping on a live project
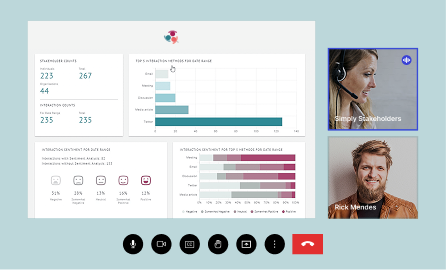
A 30-minute walkthrough of how infrastructure, energy and government teams map, track and report on stakeholders in Simply Stakeholders.
Stakeholder mapping tools: spreadsheet or software?
Most teams start in a spreadsheet, and for a small, short project that’s fine. Spreadsheets break down when:
- several people are updating the same map
- you need to link scores to the interactions and commitments behind them
- you need to report how sentiment changed over months or years
- stakeholder data includes personal information you need to protect
Purpose-built stakeholder relationship management platforms such as Simply Stakeholders keep the map connected to every interaction, so scores and positions are based on evidence and update as engagement happens. See stakeholder mapping in Simply Stakeholders.
Keeping your stakeholder map current
A map is only useful if it reflects today’s reality. Build the review into your process: after each major engagement milestone, after any issue or complaint, and before reporting to your board or regulator. Simply Stakeholders helps by enriching stakeholder records automatically, for example detecting each contact’s organisation and role, and by turning interaction history into Sentiment & Issues and Social Performance reports.
Stakeholder mapping FAQ
What is the purpose of stakeholder mapping?
To decide where engagement effort should go. It shows who is most affected and influential, where support and opposition sit, and which relationships carry the most risk.
What are the steps in stakeholder mapping?
Identify stakeholders, choose criteria, score each stakeholder, visualise the map, set engagement approaches, and review regularly.
What is the difference between stakeholder mapping and stakeholder analysis?
Stakeholder analysis is the broader assessment of stakeholders’ interests, concerns and influence. Stakeholder mapping is the step that scores and visualises that analysis so you can prioritise.
What is the best stakeholder mapping tool?
For small, short projects a spreadsheet works. For complex or long-running projects, a stakeholder relationship management platform that links the map to interaction history and reporting is more reliable.
How often should you update a stakeholder map?
At least at every project phase, and whenever a significant interaction, issue or change in a stakeholder’s position occurs.
Is the power/interest grid still useful?
As a quick first sort, yes. For decisions, it’s too simple, because it ignores impact, position and how stakeholders change over time.
Map your stakeholders on six criteria, not two
Start with the free template, or see how it works across a whole portfolio of projects.