Stakeholder Mapping: Methods, Benefits & Examples

Stakeholder mapping is an important tool for stakeholder professionals and project managers, as it allows us to analyze stakeholders, develop stakeholder management plans, and more effectively engage with stakeholders.
But very few people use stakeholder mapping to its full potential — in part, because the most commonly used stakeholder mapping models are problematic.
So let’s explore the concept of stakeholder mapping, its benefits, the different models of stakeholder mapping, which stakeholder mapping method you should use, and how to improve your stakeholder mapping processes.
What is Stakeholder Mapping?
Stakeholders are the people, groups, or organizations that are impacted by (or have an impact on) your project, organization, or work.
Stakeholder mapping is the process of placing your project stakeholders’ attributes onto a chart to visualize the data, compare the position of different stakeholders, and analyze your stakeholders based on the attributes shown. This can allow you to see where one stakeholder sits compared to others, identify trends, or organize stakeholders into groups based on shared attributes.
Learn more about this topic in our articles on the importance of stakeholders and identifying key stakeholders.
Where Does Stakeholder Mapping Fit Into Your Process?
Stakeholder mapping is part of the stakeholder analysis process. And of course, stakeholder analysis is often part of the stakeholder planning, stakeholder assessment, stakeholder engagement, and stakeholder management processes.
Why is Stakeholder Mapping Important?
Creating a stakeholder map can help you better understand and organize your stakeholders, as well as support stakeholder management and engagement objectives. This includes:
- Managing your social license to operate
- Providing evidence of engagement and that you’ve considered and engaged all relevant stakeholders
- Reducing risk that comes from failing to consider or engage an important stakeholder group (such as an indigenous group with cultural connections to the area)
- Improving efficiency by reducing risk and delays
- Identifying stakeholder interests to support success and avoid conflicts
- Developing a more comprehensive list of potential stakeholders
- Supporting an appropriate frequency of engagement
- Identifying the most effective and efficient engagement strategies
- Measuring how engagement activities impact stakeholders over time
We share more details about the benefits of stakeholder analysis (and by extension, stakeholder mapping) inside our guide to stakeholder analysis.
Who Might Need to Do Stakeholder Mapping?

Anyone that needs to manage, engage, or consult with stakeholders could benefit from stakeholder mapping. However, certain types of roles and organizations are more likely to require stakeholder mapping than others due to the nature and complexity of their work. For instance:
- Community Engagement Officers: Stakeholder mapping models can help busy community engagement professionals use their time more effectively, with the insights they need to focus on the right community member at the right time (as well as segmenting them into groups).
- Public Consultation Managers: Stakeholder mapping can help a public consultation manager to identify and group any interested groups and individuals so they can keep them informed and engaged.
- Project Developers or Project Managers: Stakeholder mapping can increase their understanding of different stakeholder attributes to support relationship building, solve problems, and reduce uncertainty.
- Communications Managers: Stakeholder mapping can be a valuable tool and process for communication managers to identify their audience, identify issues that matter to stakeholders, craft messages, determine suitable channels, and segment contacts.
- Corporate Affairs and External Relations Managers: These professionals can use stakeholder maps to identify and prioritize key relationships with media, government, industry bodies, and other stakeholders, as well as develop targeted communication strategies and risk management strategies based on the potential influence, impact, and interest of potential stakeholders.
- Account Managers: Account managers will often be tasked with stakeholder identification and engagement, and mapping those stakeholders can help them better understand the specific groups they’re dealing with and identify their needs and goals.
- Leaders of Large Organizations: Stakeholder relationship mapping (in particular) can help leaders identify key stakeholders they can strategically manage and build relationships with.
Common Stakeholder Mapping Models
There are a number of different stakeholder mapping models, but let’s take a look at some of the most common methods used.
1. Salience Model
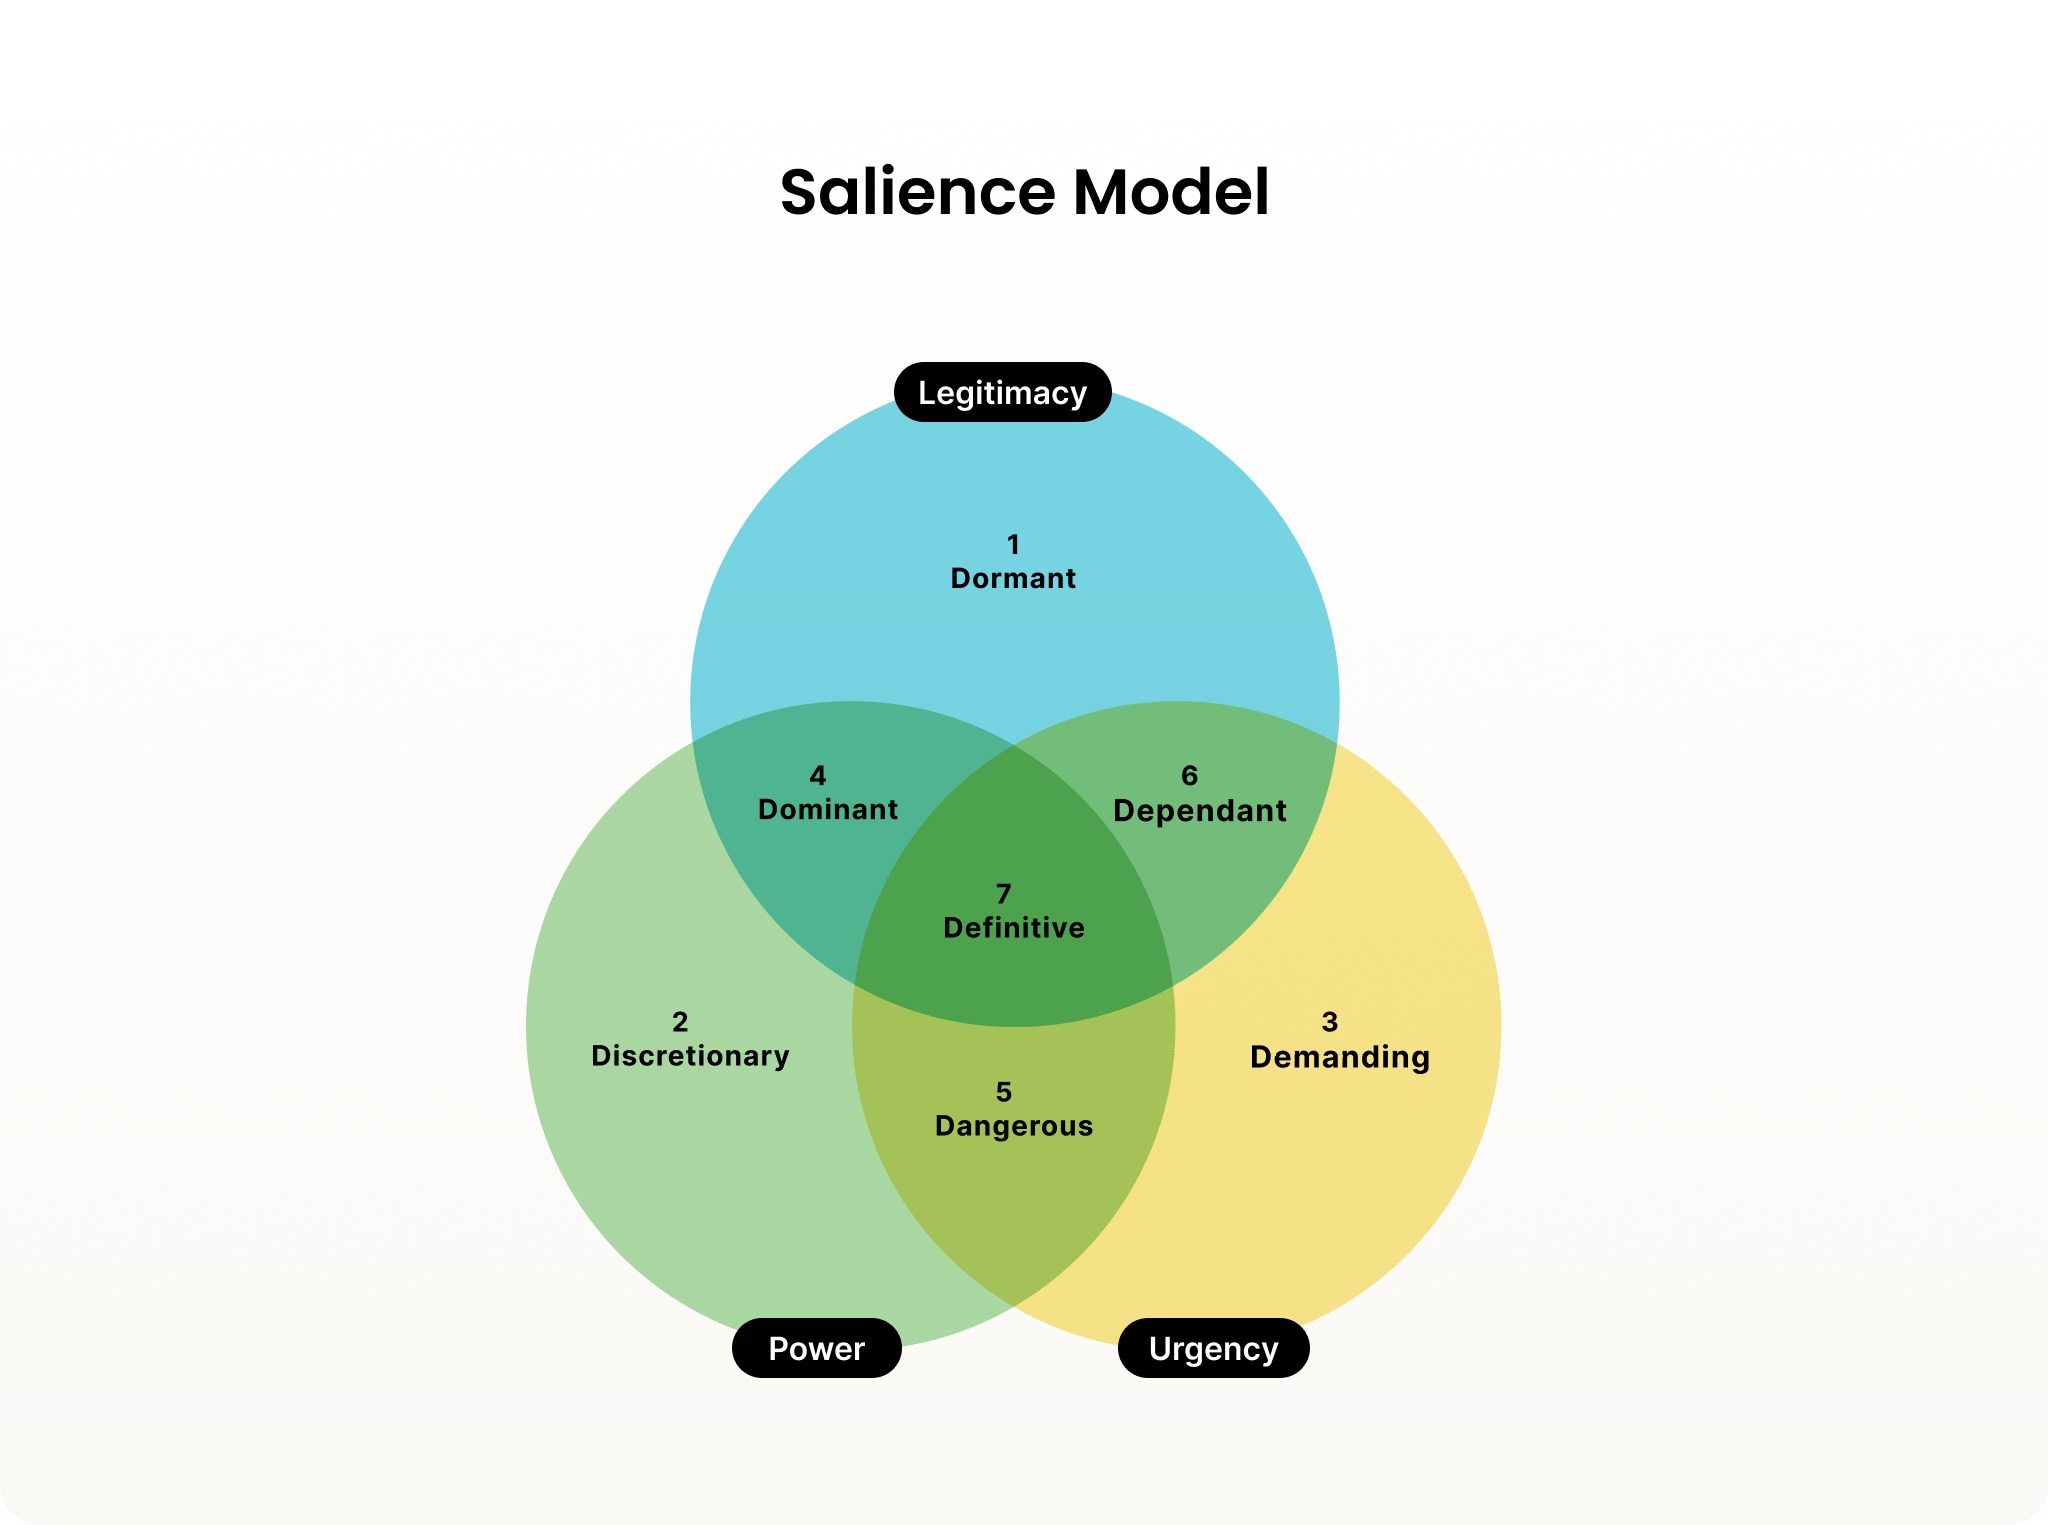
Salience refers to how prominent or noticeable something or someone is. This stakeholder mapping model is used to classify stakeholders on the attributes of power, legitimacy, and urgency. You can use the venn diagram to show how these attributes intersect, resulting in a visual representation of seven stakeholder groups with varying degrees of power, legitimacy, and urgency.
From there, these seven groups can be assigned to three categories for prioritization.
| Group | Attributes | Example | Priority |
| 1. Dormant | High power, low legitimacy, and low urgency | An executive not currently involved or interested in the project. | Priority 3
With just one salient attribute, these stakeholders often require the least amount of attention, but should be monitored in case their situation changes. |
| 2. Discretionary | High legitimacy, low power, and low urgency | A local environmental group indirectly impacted by the work you’re doing. | |
| 3. Demanding | High urgency, low power, and low legitimacy | Locals that feel strongly about the project even if it doesn’t directly impact them. | |
| 4. Dominant | High power, high legitimacy, and low urgency | Council groups with the authority to approve or deny project plans. | Priority 2
With two salient attributes, these stakeholders will benefit from regular communication and engagement to ensure the project stays on track. |
| 5. Dangerous | High power, high urgency, and low legitimacy | Individuals or groups that (while not directly connected to the project) may create trouble. | |
| 6. Dependant | High urgency, high legitimacy, and low power | Local residents that are unlikely to influence the project (without forming a group or connecting with another stakeholder who has more power). | |
| 7. Definitive | High power, high legitimacy, and high urgency | Leaders of key organizations who are closely involved in the work or project. | Priority 1
As these stakeholders have all attributes, they are your core stakeholder group. Their involvement and communication should be prioritized. |
The idea behind this model is that you can quickly identify stakeholders that may need the most attention. But it does have a number of issues and limitations:
- It uses inflammatory words like Demanding, Dominant, Dangerous, and Dependant to refer to stakeholders
- It oversimplifies prioritization based on three attributes only
- It accounts for only high or low levels of salience — there’s no ‘neutral’ option
- Power is difficult to define, especially with new media now enabling everyday people to share their opinions and gather supporters
- Power, urgency, or legitimacy are not static — they may increase or decrease throughout the project for a number of reasons
2. Stakeholder Knowledge Base Chart
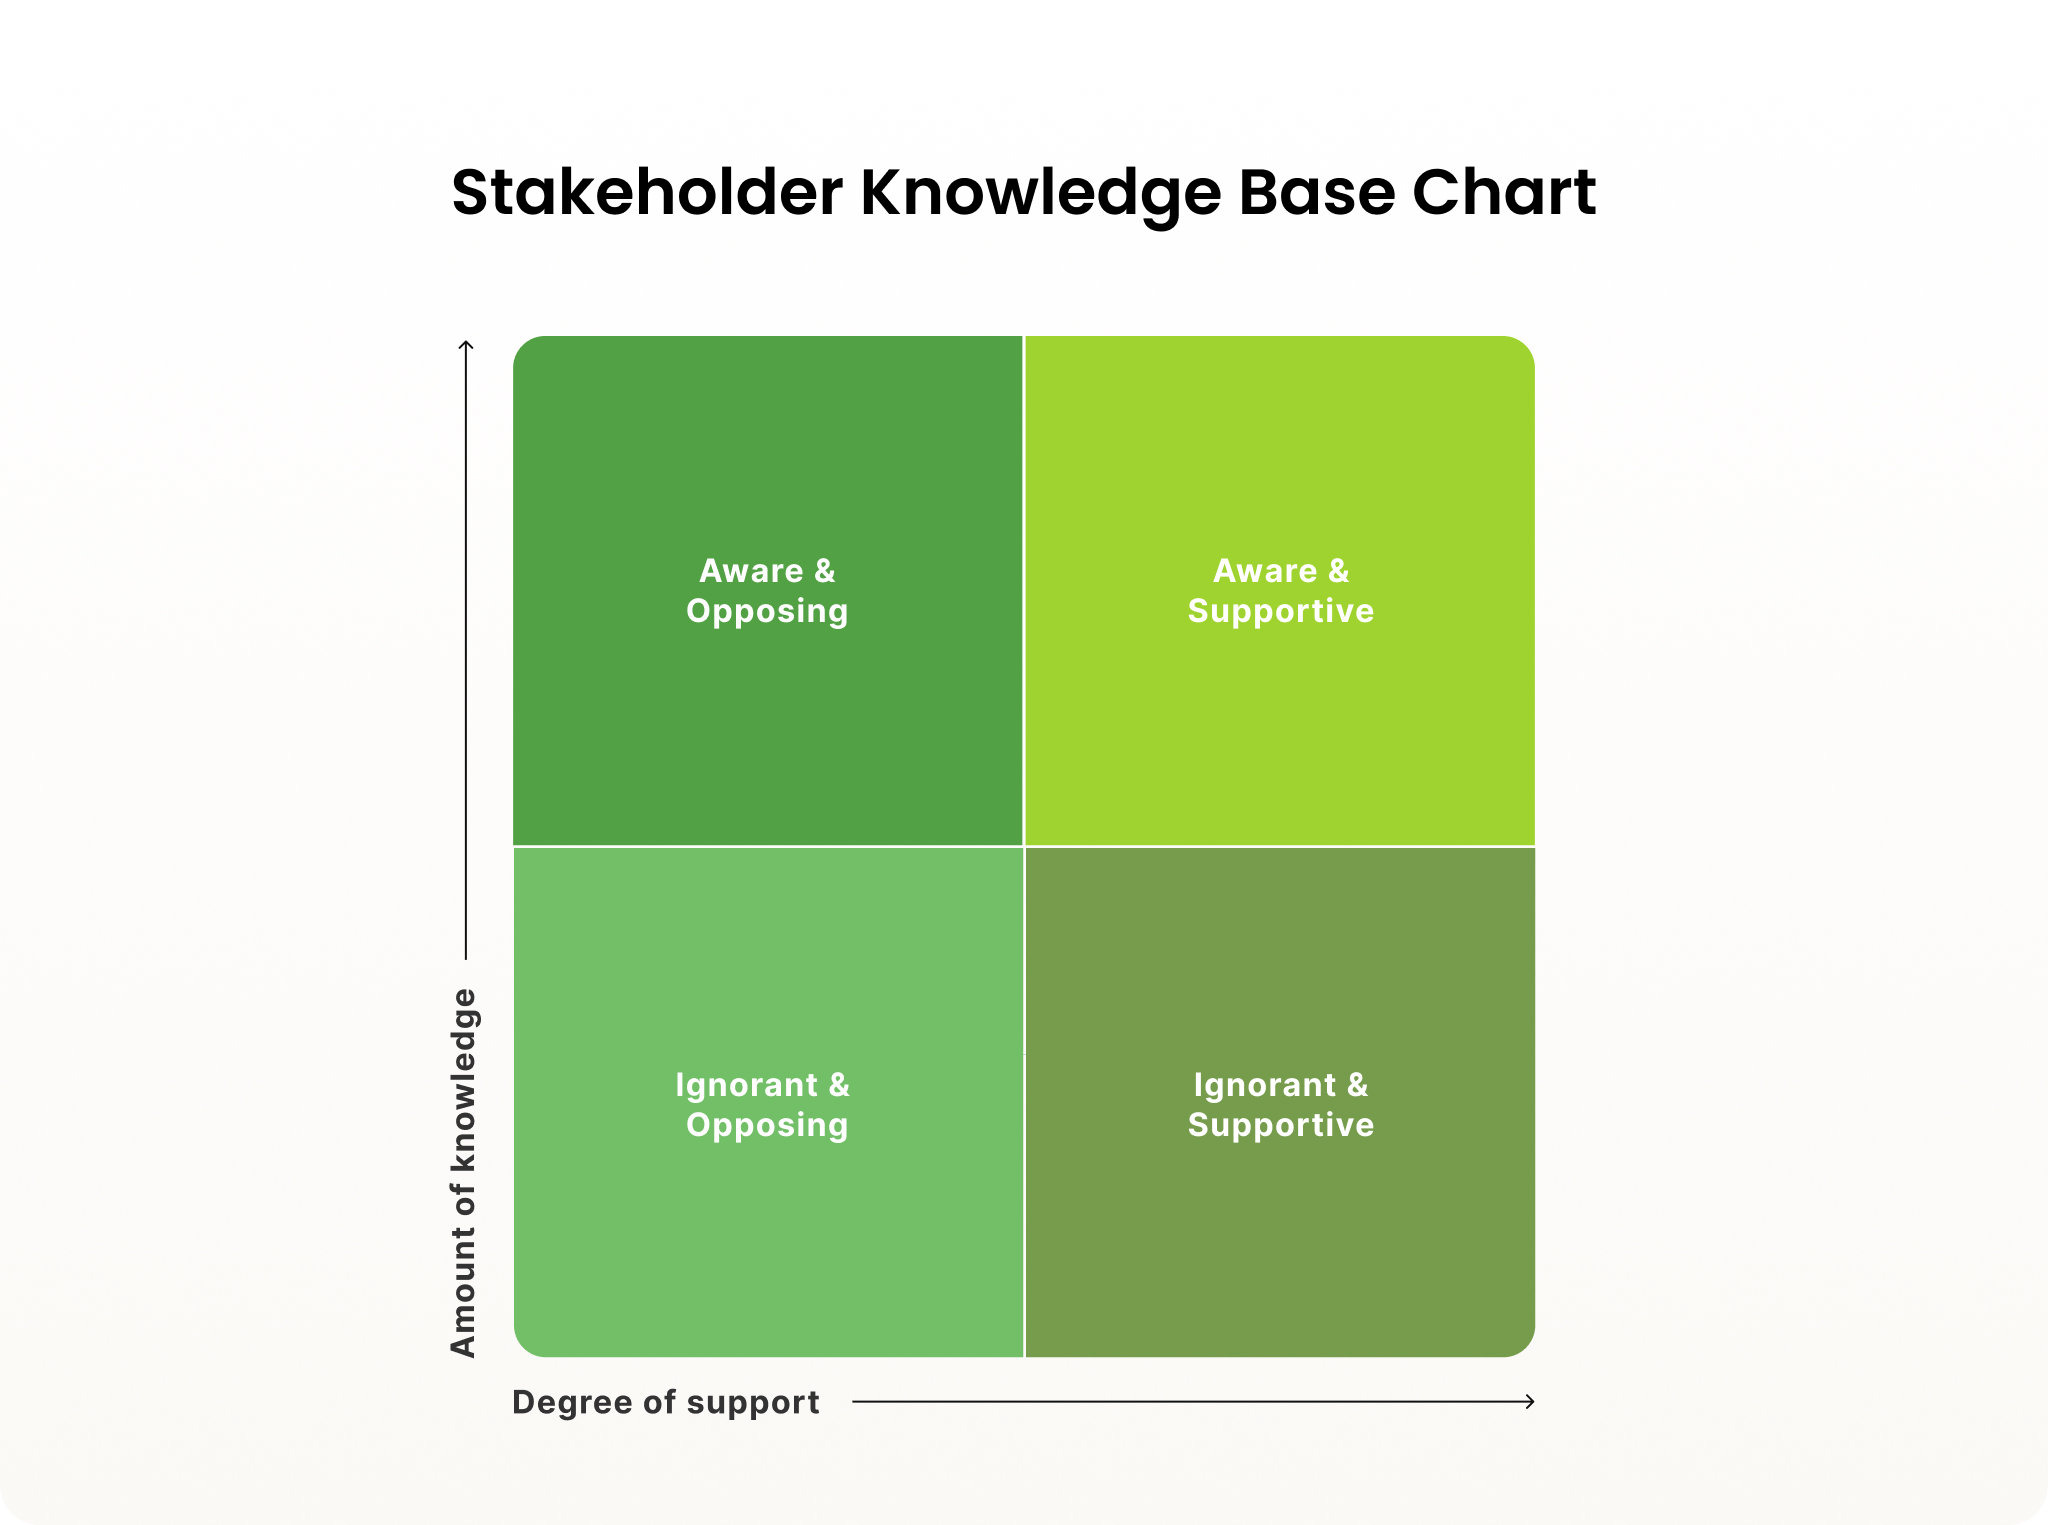
The Stakeholder Knowledge Base Chart, found in Gower Handbook of Project Management, is used for mapping stakeholders based on how much they know about a project and their attitude towards it. It includes the following quadrants:
- Aware / Opposition – These stakeholders may be a risk and require management.
- Aware / Support – These stakeholders are worth keeping informed so they can continue to champion your project or work.
- Ignorant / Opposition – Increasing the understanding of these stakeholders may help to change their attitude.
- Ignorant / Support – Engaging with these stakeholders will help to keep them onboard and strengthen their support.
This approach may be used to tailor communication and engagement strategies to different stakeholder groups, but before you incorporate this model into your processes, consider the following issues:
- Ignorant isn’t the kindest language to use when describing someone
- Opposition/Support are very limited descriptors of stakeholder attitude
- It fails to consider other attributes like issues, interest, and impact
3. Power/Interest Grid
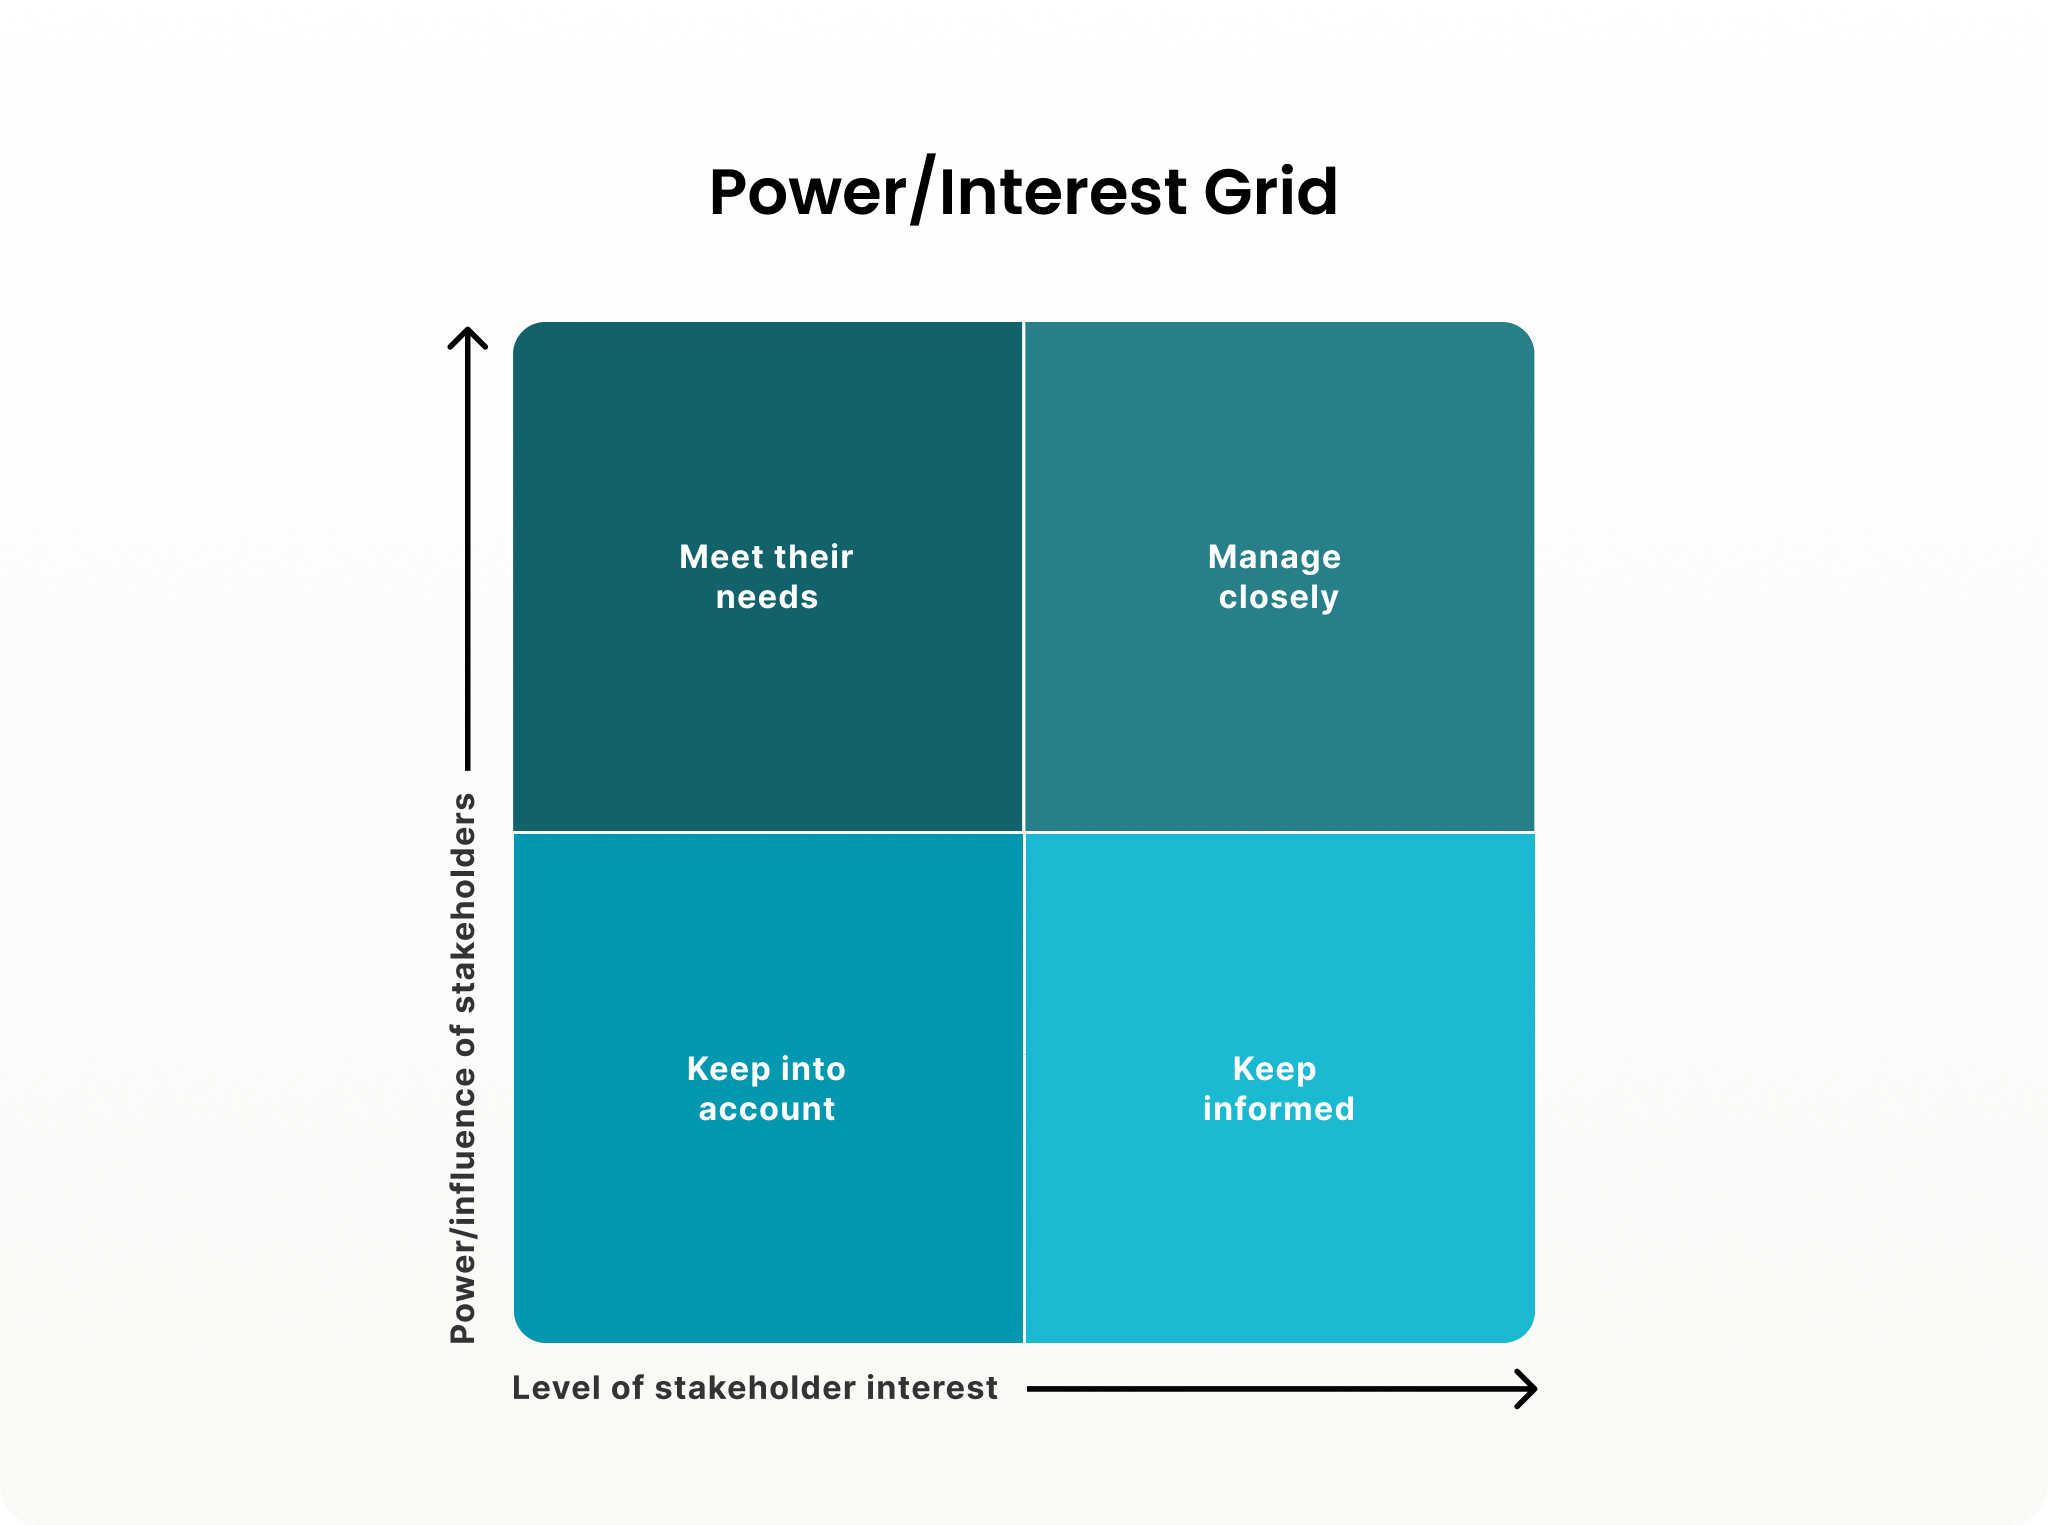
The Power/Interest Grid is used to map stakeholders on to four quadrants, based on stakeholders’ level of power or influence, and their level of vested interest. Each quadrant requires different actions or levels of engagement:
- High power / high interest – Manage closely, regularly engage, and manage expectations
- High power / low interest – Meet their needs, keep them satisfied, and actively consult
- Low power / low interest – Monitor and provide information as needed
- Low power / high interest – Keep informed and maintain interest
The model offers a simple way to classify stakeholders and tailor your engagement strategy. But like the other models here, it also has its limitations:
- Without sentiment or attitude, this model lacks important context — you don’t know if your high power / high interest stakeholders are for or against the project
- Power is tricky to define — nearly any stakeholder has the potential to become powerful
- Level of interest is perhaps less useful than listing out what those interests are
4. Power-Predictability Matrix
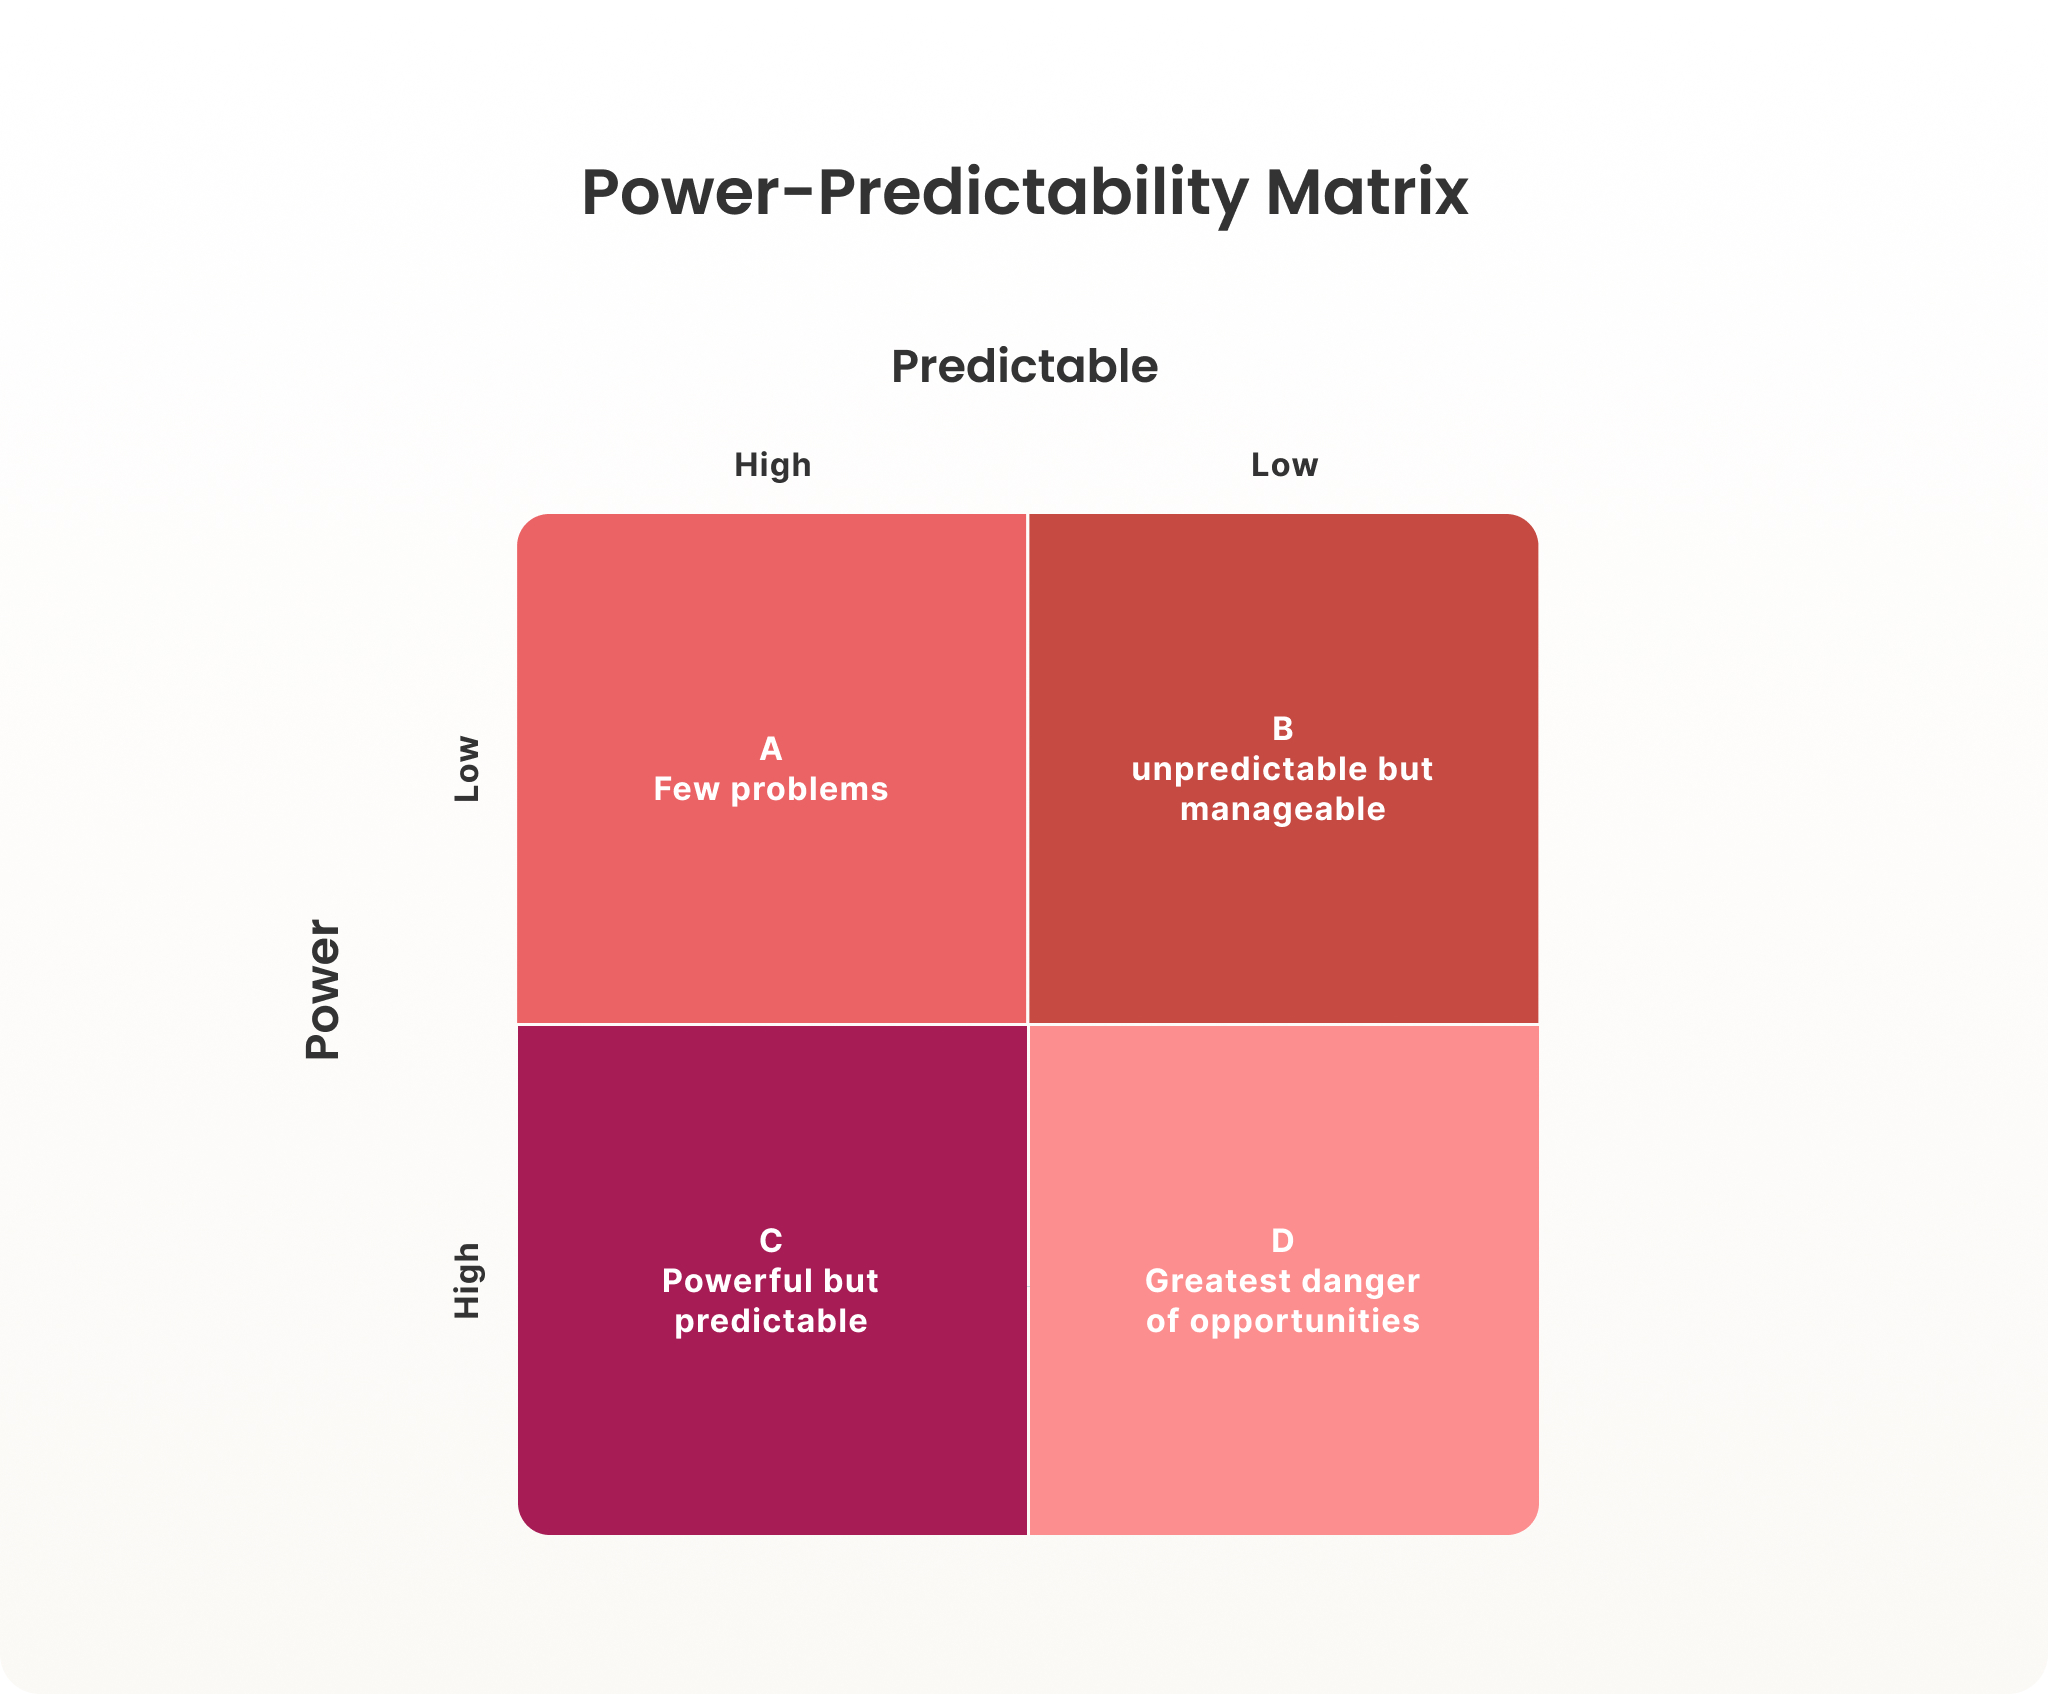
Power/Predictability Matrix is very similar to the Power/Interest Matrix, but has a focus on predictability rather than interest. The idea behind this model is that greater levels of unpredictability (combined with higher power) can present more of a challenge in stakeholder management. It is supposed to identify which stakeholders require closer monitoring, higher levels of satisfaction, faster responses, and a more hands-on approach.
Once again, this matrix isn’t perfect. Consider these limitations and issues:
- Like many other popular models, there are problems with analyzing stakeholders based on power
- Are any humans truly predictable? And if so, how can you reliably say who is or isn’t?
- It positions stakeholders as problems or challenges to be managed
Stakeholders are dehumanized with words like Unpredictable but manageable, Few problems, and Greatest danger or opportunities
5. Stakeholder Relationship Mapping
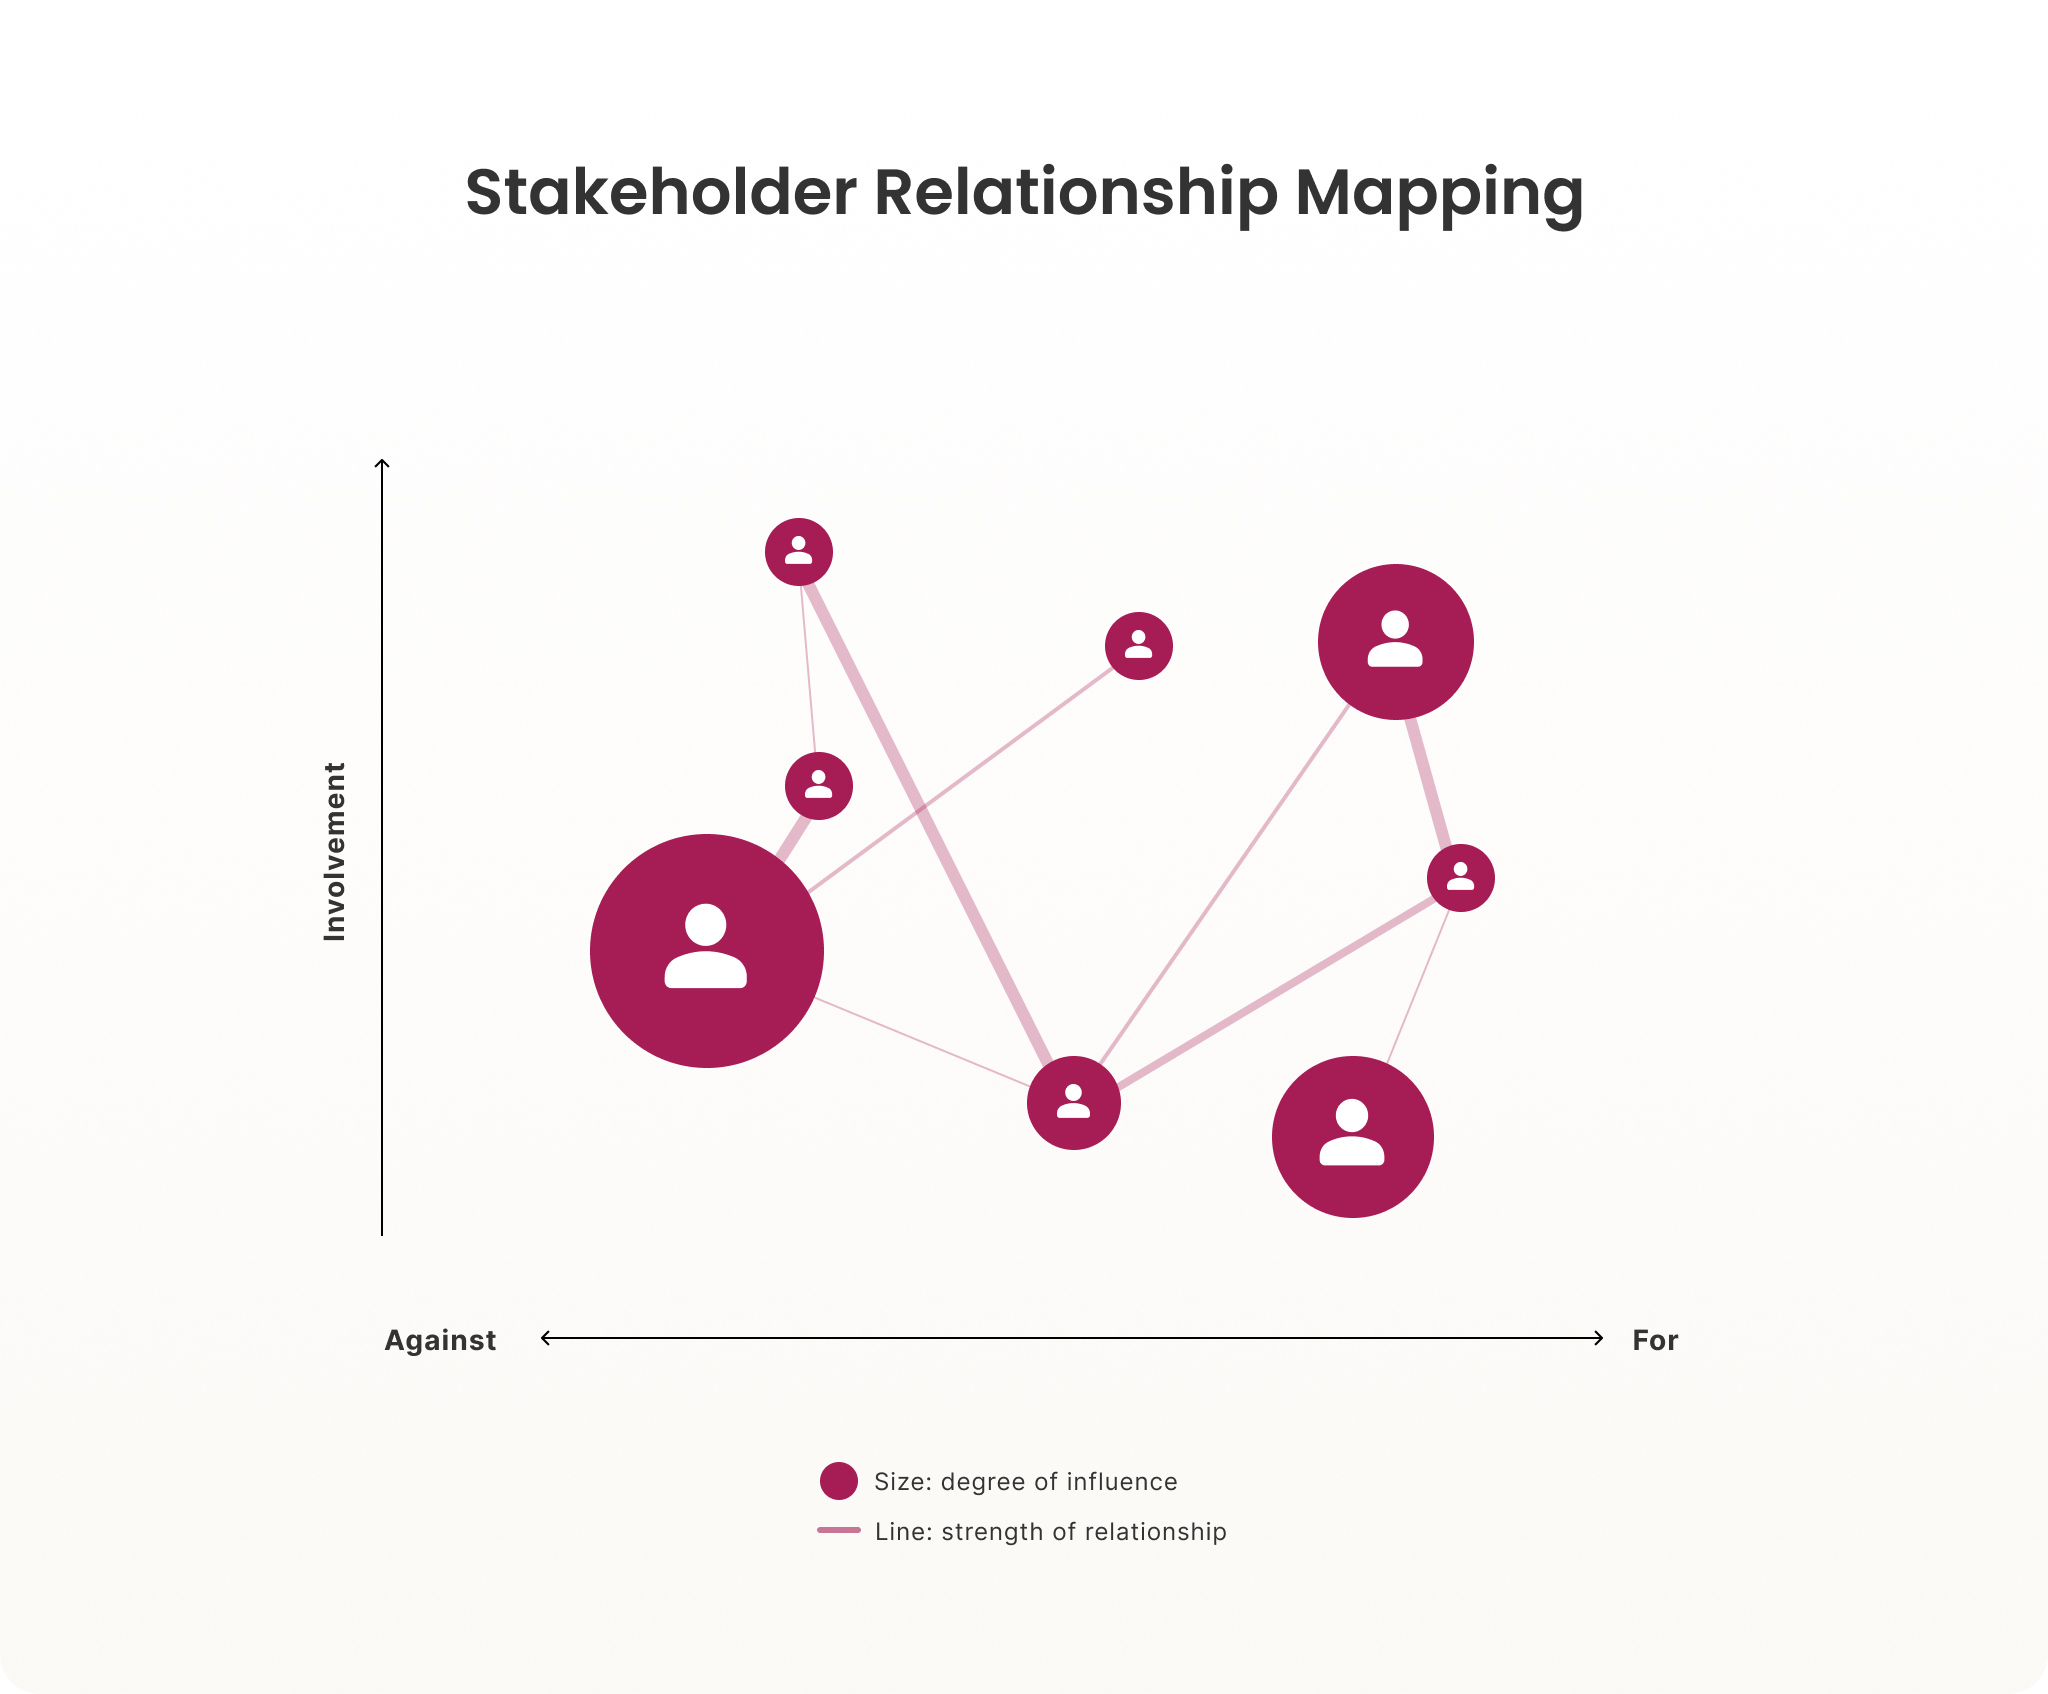
Stakeholder relationship maps can help you visualize how stakeholders are linked. Some mapping tools allow you to show the strength of relationship and degree of influence, while also placing stakeholders on a scattergram according to other attributes, like their level of involvement, and sentiment.
This can help with understanding power and influence and potential ways to group stakeholders. But it doesn’t cover everything. Before using this type of model, consider that:
- Complex relationship maps can be difficult to create (and keep up to date)
- With various lines and shapes, these can be tricky to read (especially if you have a lot of stakeholder groups)
- You’re limited on what attributes you can show
- It’s difficult to accurately map stakeholder relationships and influence without first spending a lot of time with the stakeholder groups
6. Stakeholder Mapping Spreadsheets
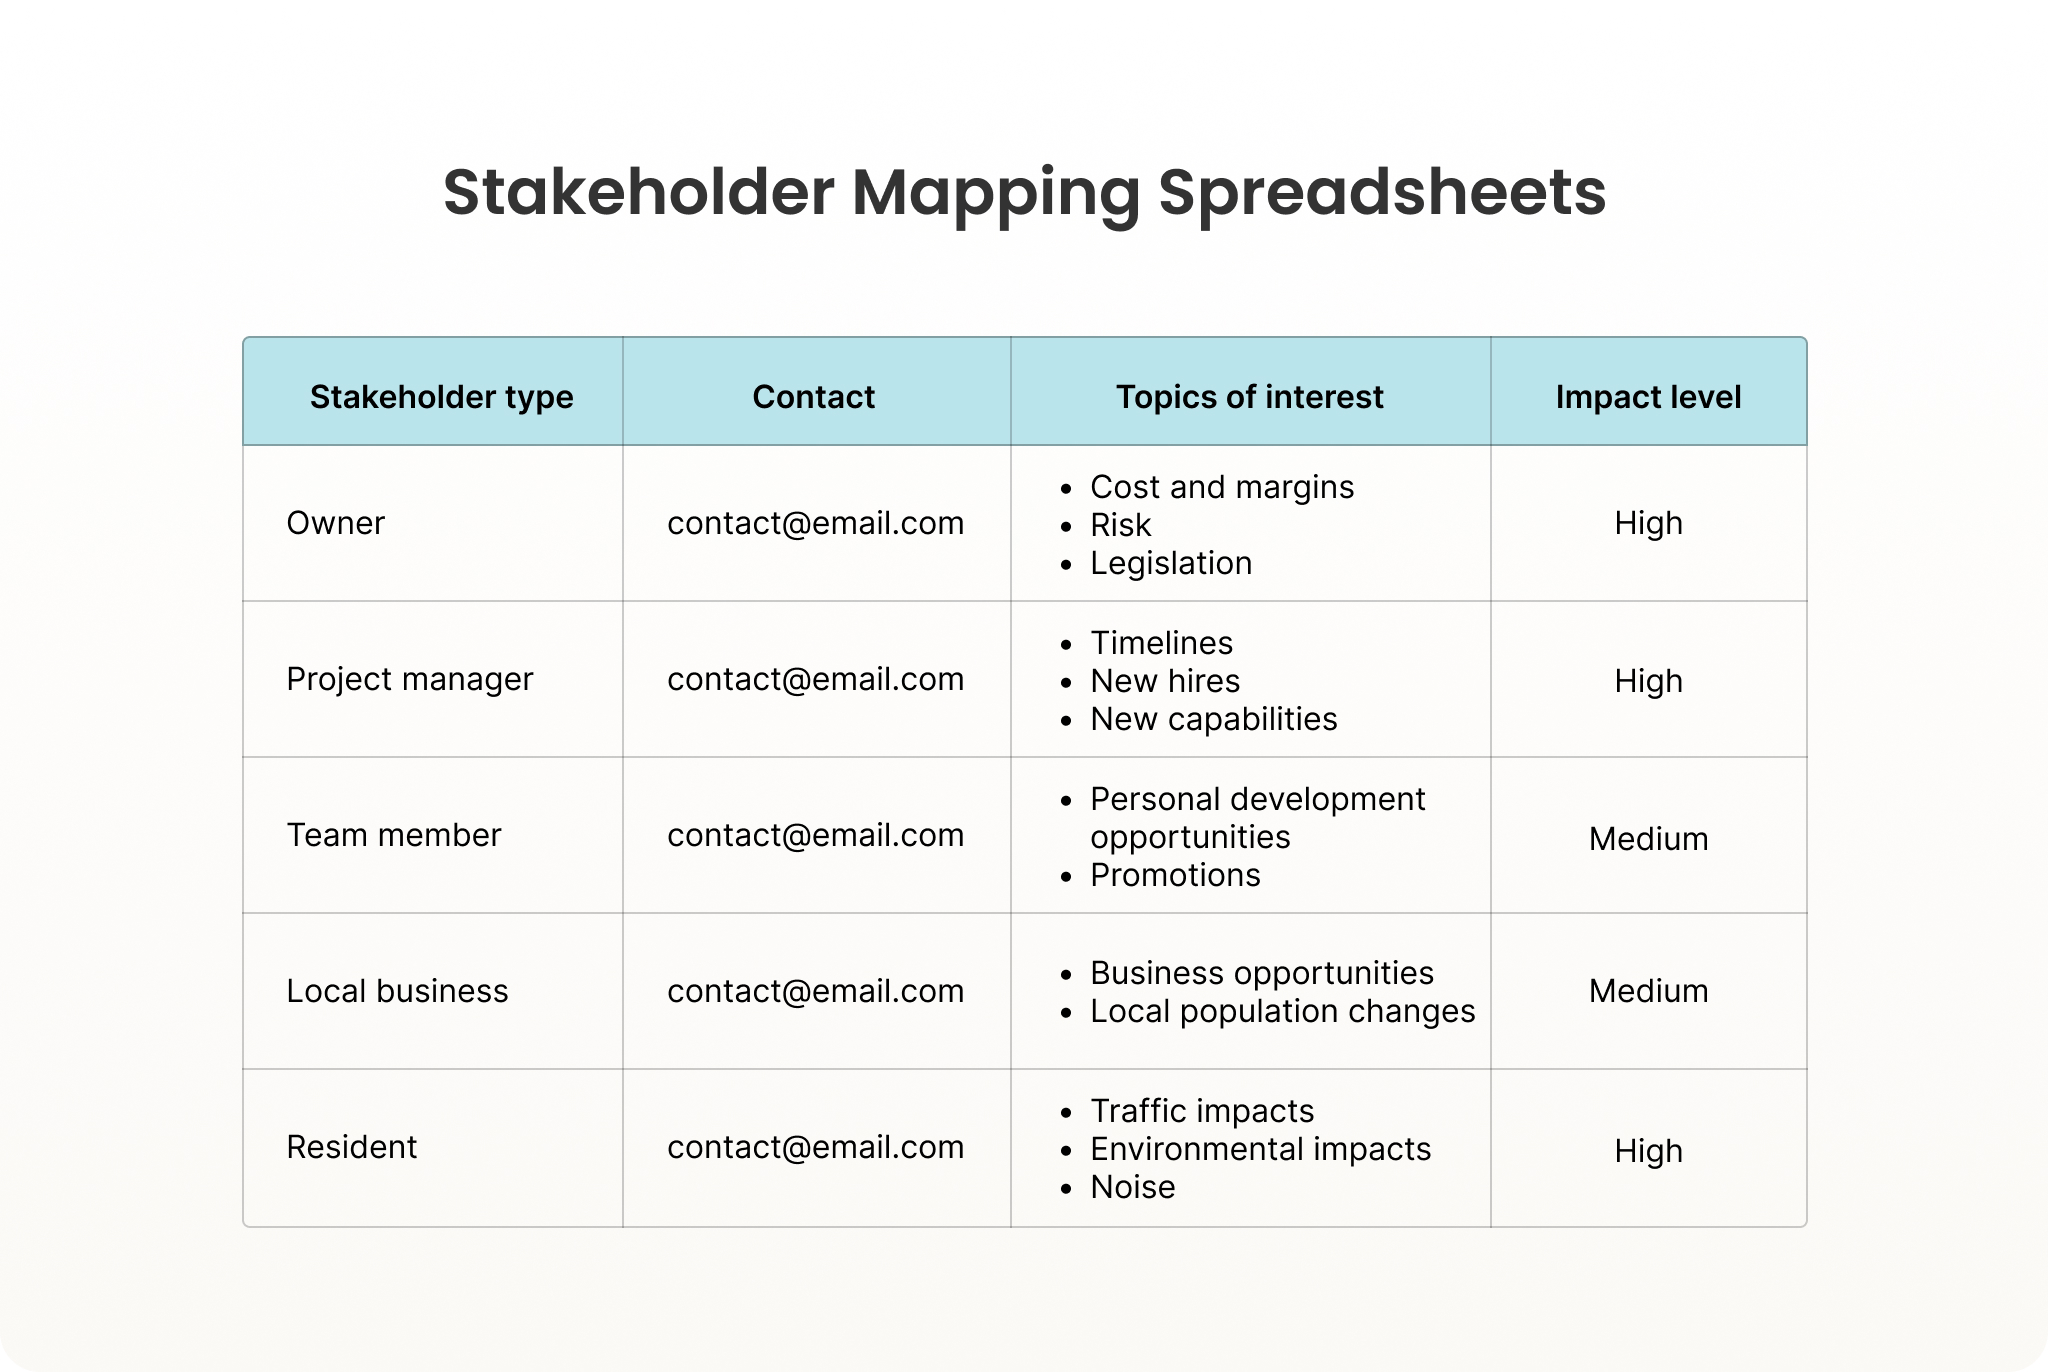
While you can use software or even pen and paper to map stakeholders onto a grid or chart, a lot of stakeholder mapping is done in spreadsheets. Columns can be added to make note of any attributes, alongside stakeholder contact info.
This approach offers a lot of flexibility — and spreadsheets are a very accessible tool, but (you guessed it!) also has some issues that are worth considering. Though you can add a lot of context (and unlimited attributes) to each individual contact record, a spreadsheet can’t tell a story at a glance like some of the more visual methods. They also come with problems like duplication, data security, difficulty collaborating, limitations, and much more. With this in mind, we don’t generally recommend spreadsheets for stakeholder mapping or stakeholder management.
Problems with Common Stakeholder Mapping Models

Noticed a theme emerging from our list of common stakeholder mapping models? They all have problems and limitations. And even if everyone (or nearly everyone) is doing it, it doesn’t mean that it’s right.
Problems with these models include:
- They’re out of date: The world of stakeholder engagement and public participation has evolved over the past 30+ years since these models were created, and the mapping methods have not.
- Power is different: Power used to be more hierarchical, centrally held by governments and businesses that sometimes shared it with the community (if they had to), but these days, power is less tightly held and more dynamic, with technology changing the way people connect, communicate, and influence.
- Stakeholders expect more: These days, stakeholders expect to have a greater say in decisions than they used to, and want to be informed and have the opportunity to voice concerns, even if they aren’t significantly impacted by a project.
- Language has changed: With greater social and cultural sensitivity (especially as brands engage on a global scale and with diverse populations), the language used in many stakeholder models is overdue for an update and could be considered offensive in today’s world.
- They’re not practical: There’s demand for more practical stakeholder maps that can be used to inform actions, reporting, and analysis throughout the project (rather than pretty diagrams that sit in a report, never to be referred to again).
By the way, we cover the stakeholder mapping models you see here, along with additional models/frameworks in our blog on stakeholder diagrams.
Become a Subscriber Don’t miss out on more insights like this! Subscribe to get our regular updates.
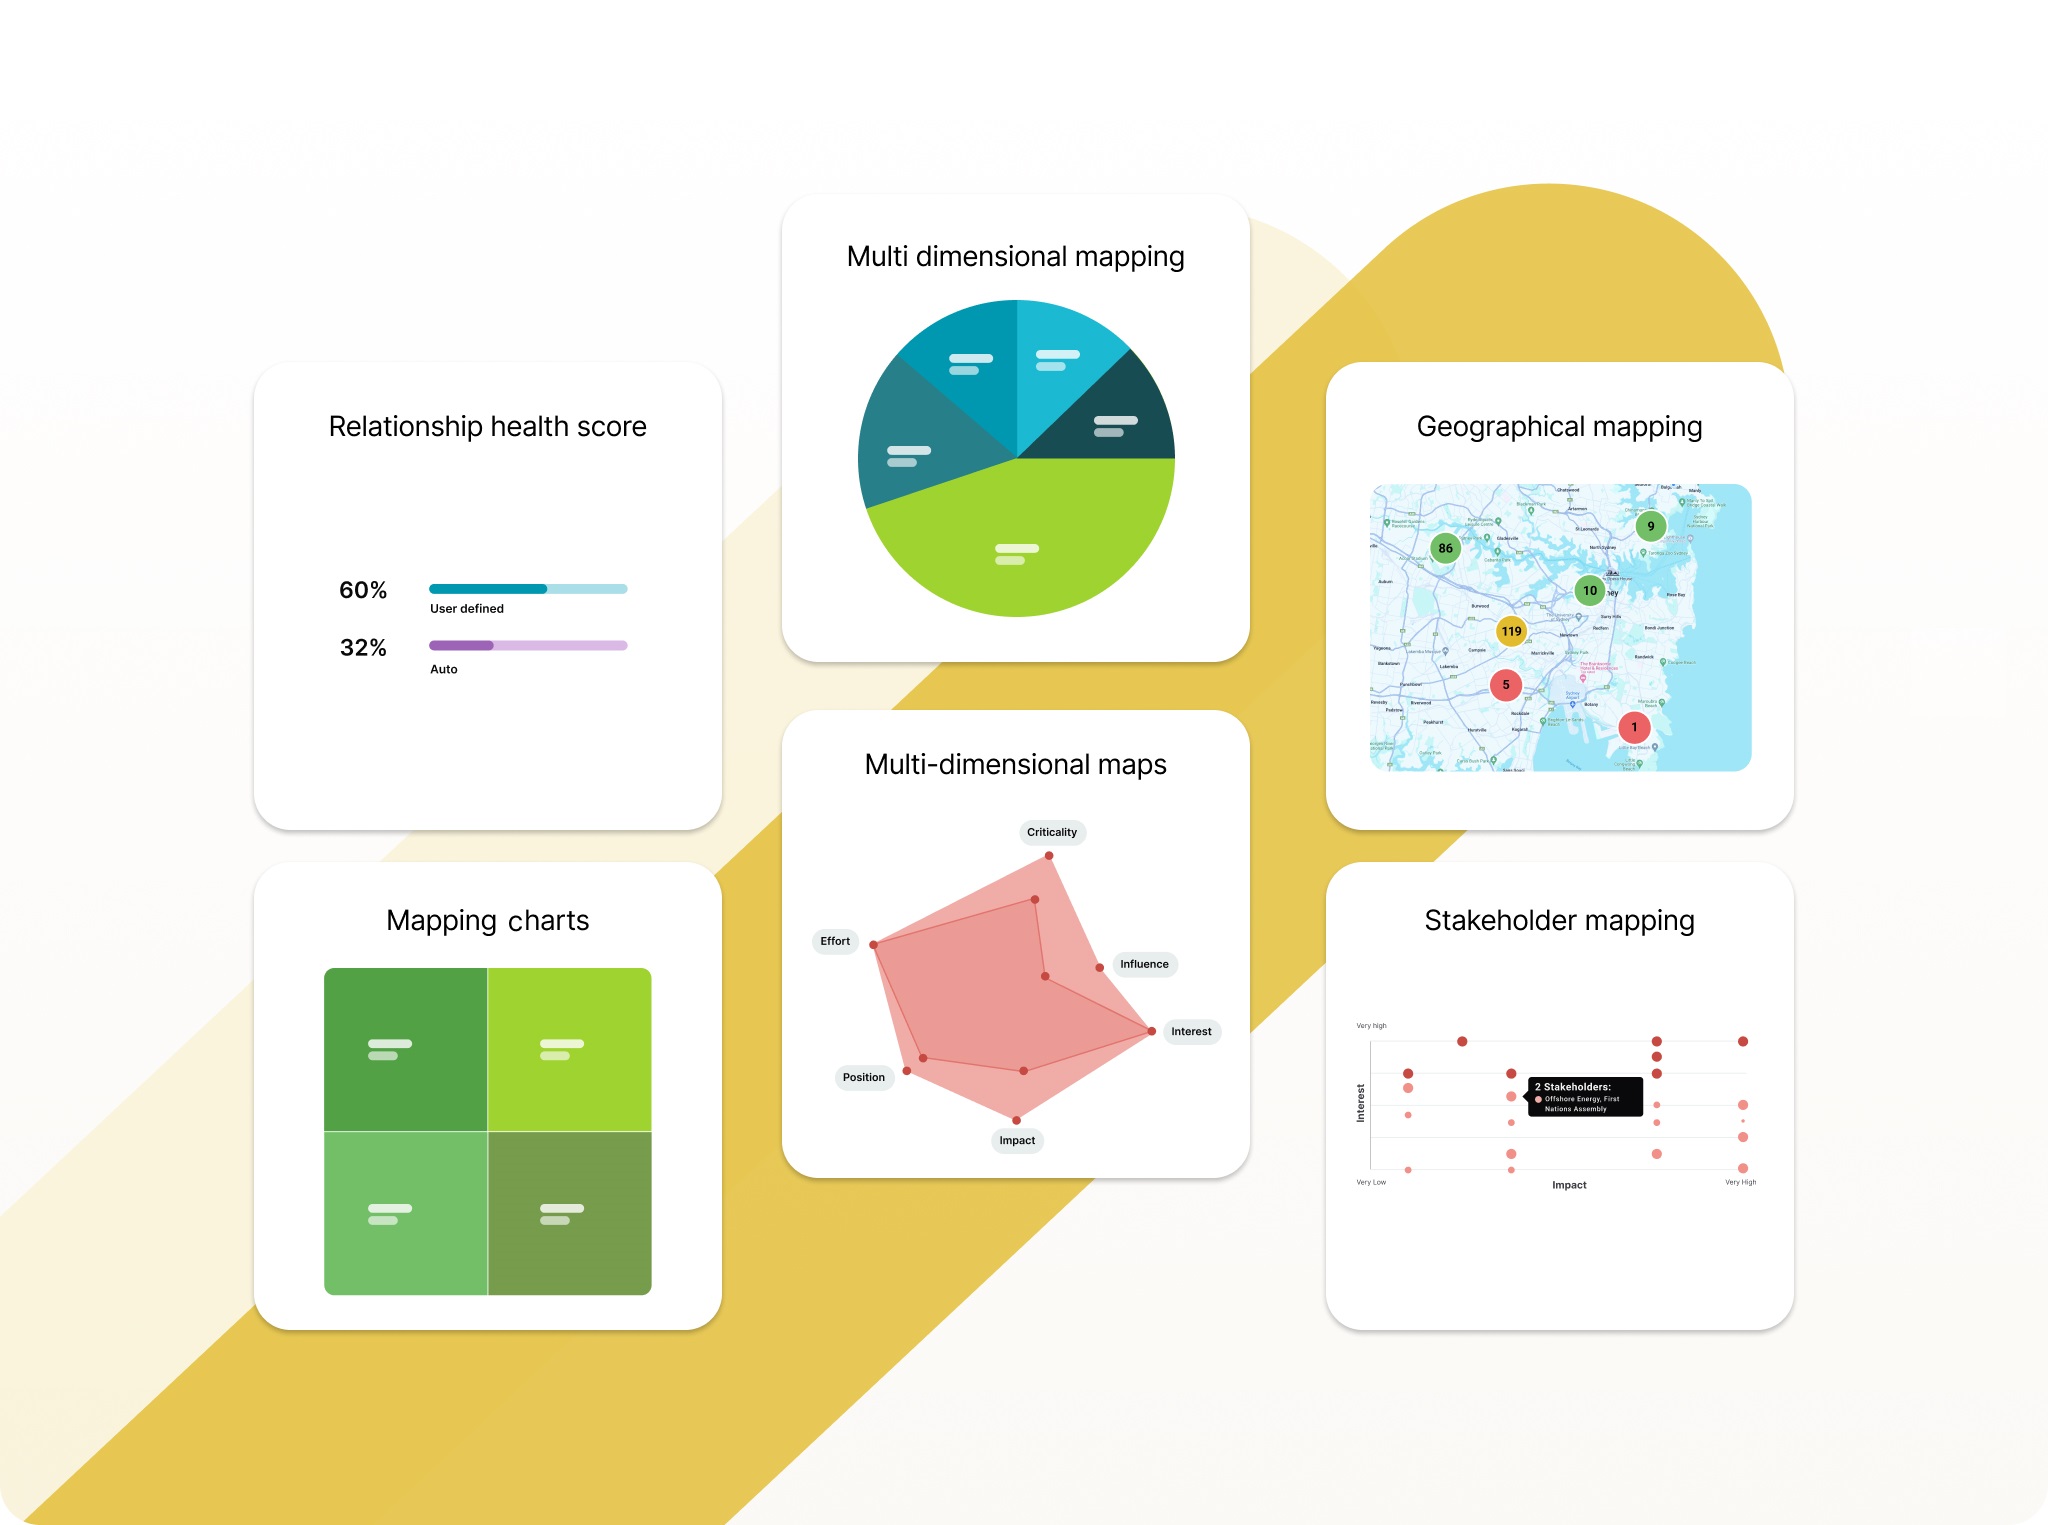
A Better Approach: Multi-Dimensional Stakeholder Mapping
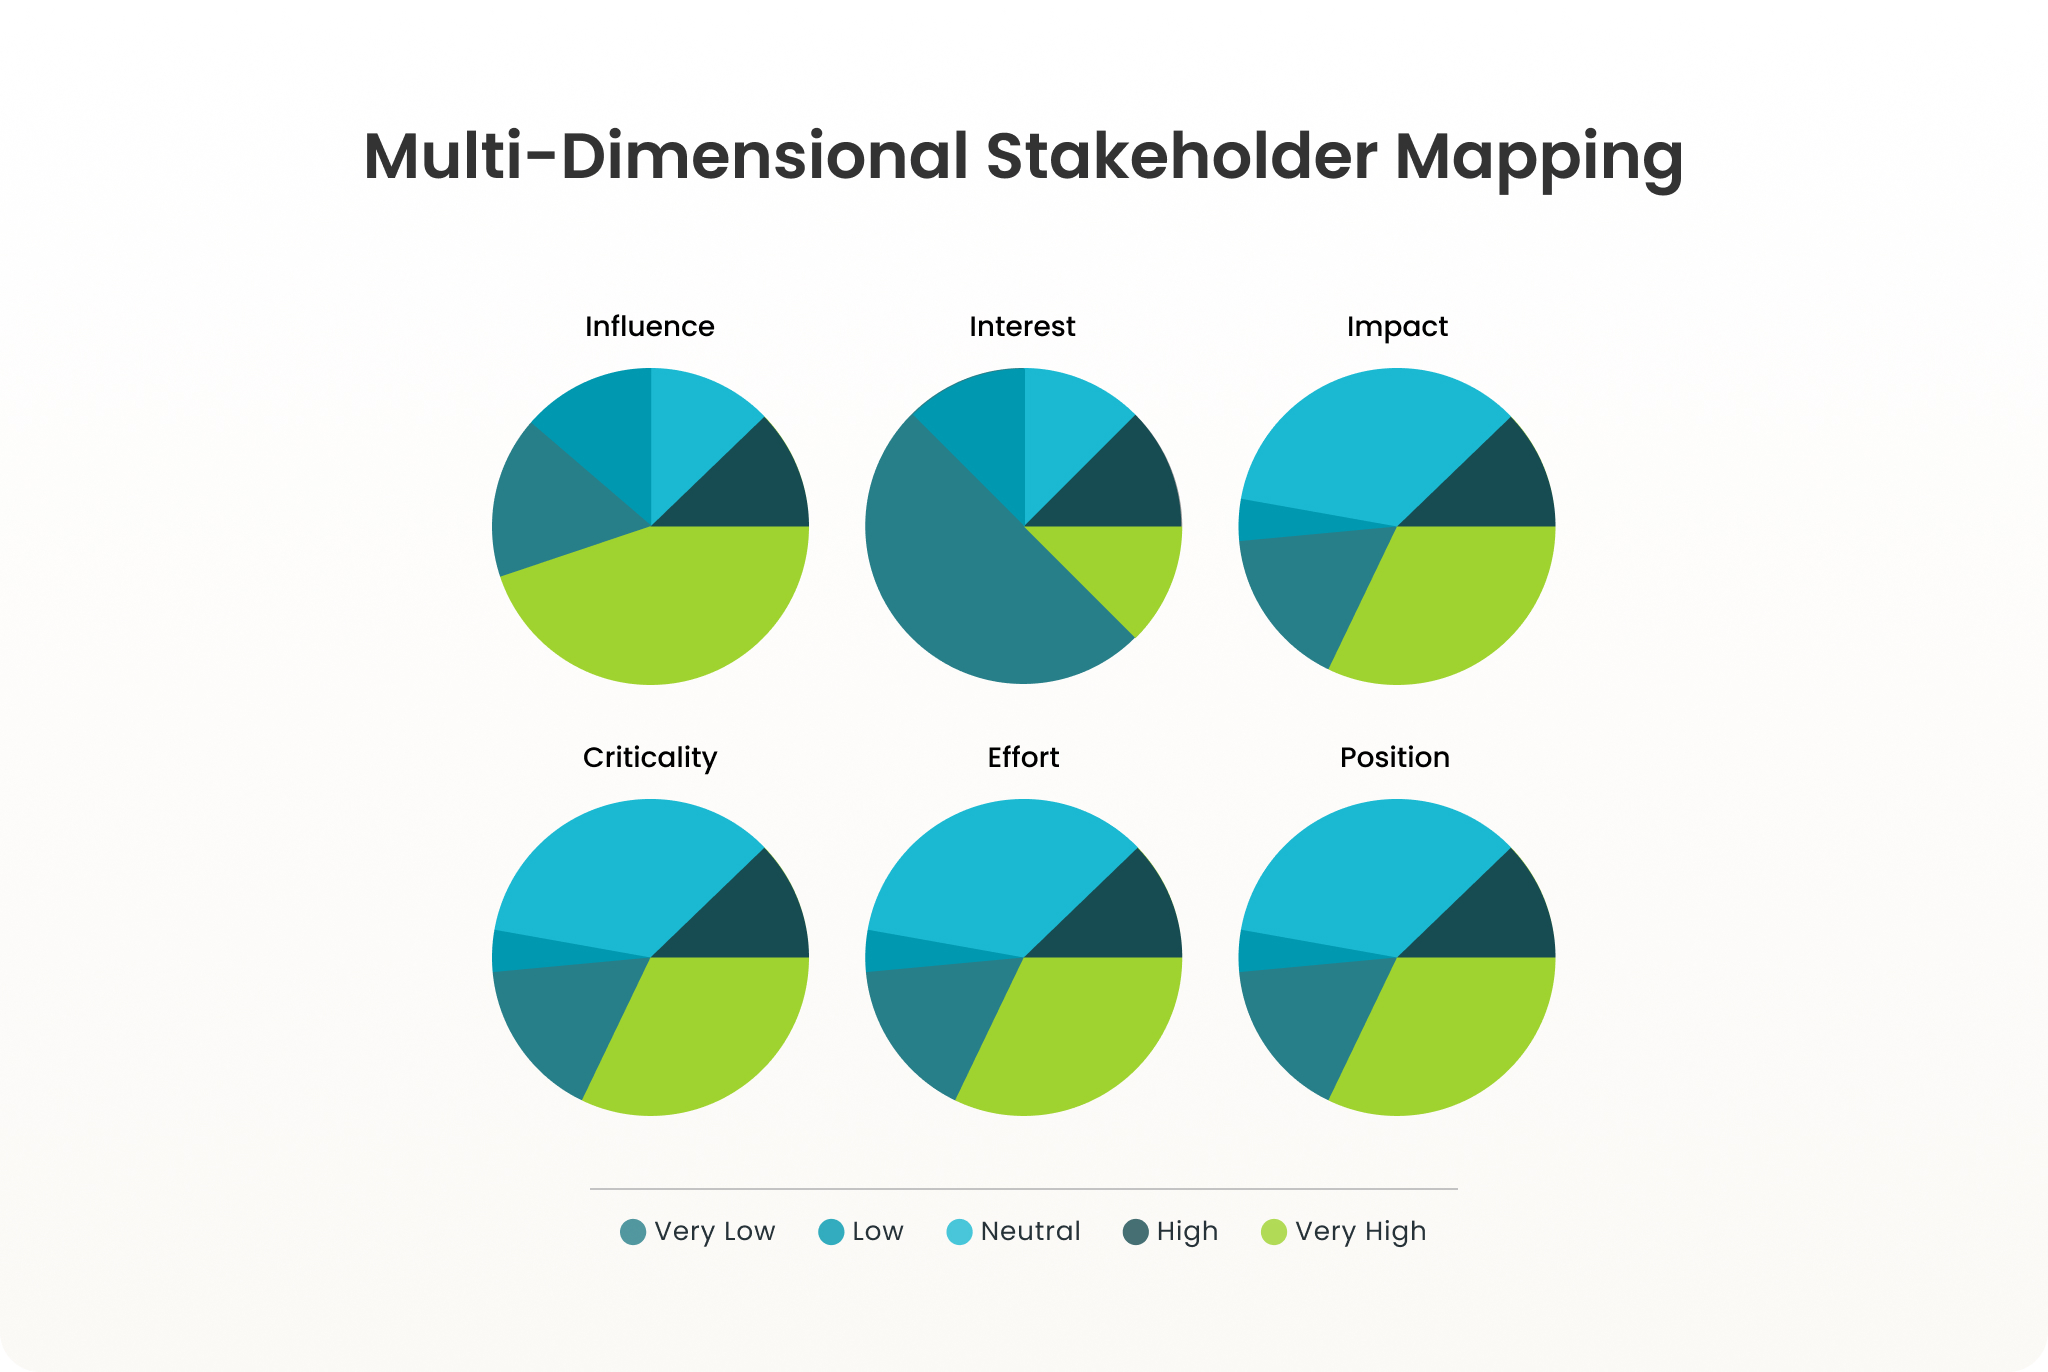
At Simply Stakeholders, we looked at how we could reimagine stakeholder mapping so that it would be useful. We wanted a more multidimensional model, with the ability to segment by contact groups.
Our preferred method (which is built into the Simply Stakeholders software product) allows you to give each stakeholder a value across 6 attributes, on a spectrum from very low to very high. These attributes include:
- Influence: How likely will the project be influenced by the individual, community, or workplace?
- Interest: To what degree will their specific interests (cultural, social, economic) in the project be affected?
- Impact: How likely is it that the project will impact the individual, community, or workplace?
- Criticality: How critical is the stakeholder to the success of the project?
- Position: What is the stakeholder’s position towards the project?
- Effort: How much effort will it take to engage the stakeholder?
By mapping your stakeholders based on all these attributes, you can more effectively segment and prioritize stakeholders, track their movements over time, and ensure you’re engaging with those stakeholders most affected by your project or work. Plus, you can use these attributes to generate visual charts that bring your data to life — perfect for referencing in consultation reports.
|
3 Stakeholder Mapping Examples
The following hypothetical examples demonstrate how you could apply stakeholder mapping techniques to various projects and scenarios within your organization.
Stakeholder Mapping for an Offshore Wind Project

A large energy company was preparing to develop an offshore wind farm, with around 30 turbines, situated some 20 km off the coast of a popular beachside suburb. In order to proceed with project planning and development, they needed to consult with stakeholders. These include regulatory agencies, politicians, fishing groups, tourism groups, local commerce chambers, environmental groups, residents, and regular visitors to the beach.
To better understand how each stakeholder group might be best consulted and engaged, they used several stakeholder mapping methods:
- Multi-dimensional stakeholder maps: Mapping the interest, impact, influence, criticality, position, and effort of all stakeholder groups and individuals
- Geographical mapping: Visualizing all stakeholders, their primary activities, and the project on a location map
- Stakeholder relationship network maps: Visualizing and tracking the relationships between the company and stakeholders, as well as relationships between stakeholder groups via network mapping
The stakeholder mapping process enabled the following outcomes:
- Supporting the energy company to meet their stakeholder consulting obligations and deliver a better project overall
- Categorizing stakeholders to provide a tailored messaging and engagement approach
- Gaining more detailed insights into the local area, informing the location and timing of the project
- Prioritizing key players based on the anticipated impact of the project
- Strategically building new relationships via existing contacts, and tracking the strength of these relationships, along with their impact on support for the project
Stakeholder Mapping for a New Health Facility Development

A large private health services company was planning to build a large, new medical facility in an urban area that was underserved by existing services. They anticipated that this facility would provide spaces for specialists to consult with patients, as well as a pharmacy, GP clinic, and a private day hospital for minor procedures. In order to understand the potential demand for and impact of the new proposed facility, they needed to engage with external stakeholders.
With so many varying stakeholder groups, it was important to undertake stakeholder mapping in a way that supported effective stakeholder management. Methods used included:
- Multi-dimensional stakeholder maps: They determined the interests/impacts/influence/criticality/position/effort of each group or individual, using this to identify key groups to engage with sooner or more frequently
- Power/Interest Grid: They helped to confirm prioritization for engagement, while understanding who might only need to be kept informed vs actively engaged
The stakeholder mapping process enabled the following outcomes for the business:
- Planning the engagement efficiently, allowing them to get valuable input on the new development early on in the process
- Gaining insights that helped to shape key decisions like confirming what type of facilities might be needed, the types of specialists most in demand, and the size of the facility (accounting for future growth)
- Designing features to minimize negative impacts on surrounding residents and businesses (such as a large underground parking area with access on two streets)
- Building relationships with stakeholders who would one day occupy a space in the facility, allowing them to get involved in the construction process and help to shape their future premises
Stakeholder Mapping for Education Policy Change

A state education system was planning to overhaul a series of policies in order to boost student literacy in both primary and secondary schools. They knew that stakeholder consultation would be critical to ensure they understand the potential impacts of the changes — and those stakeholders who might be interested in or influential on the process.
Before consulting with their stakeholder groups, including parents, students, teachers, principals, school administrators, board members, and education policymakers, the team started with these stakeholder mapping methods:
- Multi-dimensional stakeholder maps: To determine the interests/impacts/influence/criticality/position/effort of each group or individual so they could segment groups and tailor the consultation
- Stakeholder Knowledge Base Chart: To determine which stakeholders and groups may know more or less about the issue — and their level of support
As a result of stakeholder mapping, the consultation team got off to a solid start with updating their policies, with outcomes including:
- Visualizing all their key stakeholder groups and categorizing them in multiple ways, including interest, influence, impact, awareness, and support
- Creating specific messaging for different groups, and targeting them with different methods of consultation (from semi-regular updates through to focus groups and one-on-one meetings)
- Operating more efficiently and effectively
- Leading to policy changes that were better informed and more supported
3 Tips for Successful Stakeholder Mapping
Before we wrap things up, let’s touch on three final tips that will help you get more from your stakeholder mapping process.
1. Use Multiple Mapping Methods
It’s ok to use a number of different stakeholder mapping and analysis methods. It might even make sense for you to use more than one model in order to look at your stakeholders through different lenses and deepen your understanding.
2. Use Stakeholder Maps to Drive Strategy and Reporting
Ideally, stakeholder mapping should add value to and influence the entire engagement process — and not just be something that’s done at the start of the project or work and then set aside. Especially since you are likely to get more accurate and detailed insights from stakeholders after the project begins.
Your maps should be actionable and a key strategic driver. Bring your stakeholder charts into discussions, planning, and reporting, and use them to develop strategies and track your progress.
3. Reference Stakeholder Mapping Values Regularly
Stakeholder mapping is not a set and forget exercise — this is why a stakeholder system like Simply Stakeholders with automatically updated maps offers a huge advantage! They’re a powerful tool for monitoring change, especially when your stakeholder tools can track historical data like interest, influence, and impact over time. In Simply Stakeholders, you can even use your stakeholder maps for filters, reports, setting triggers for automated workflows, and more.
To get maximum value from your stakeholder maps, make a habit of regularly referring back to your mapping values and keeping your stakeholder systems up to date.
Stakeholder Mapping Features Inside Simply Stakeholders
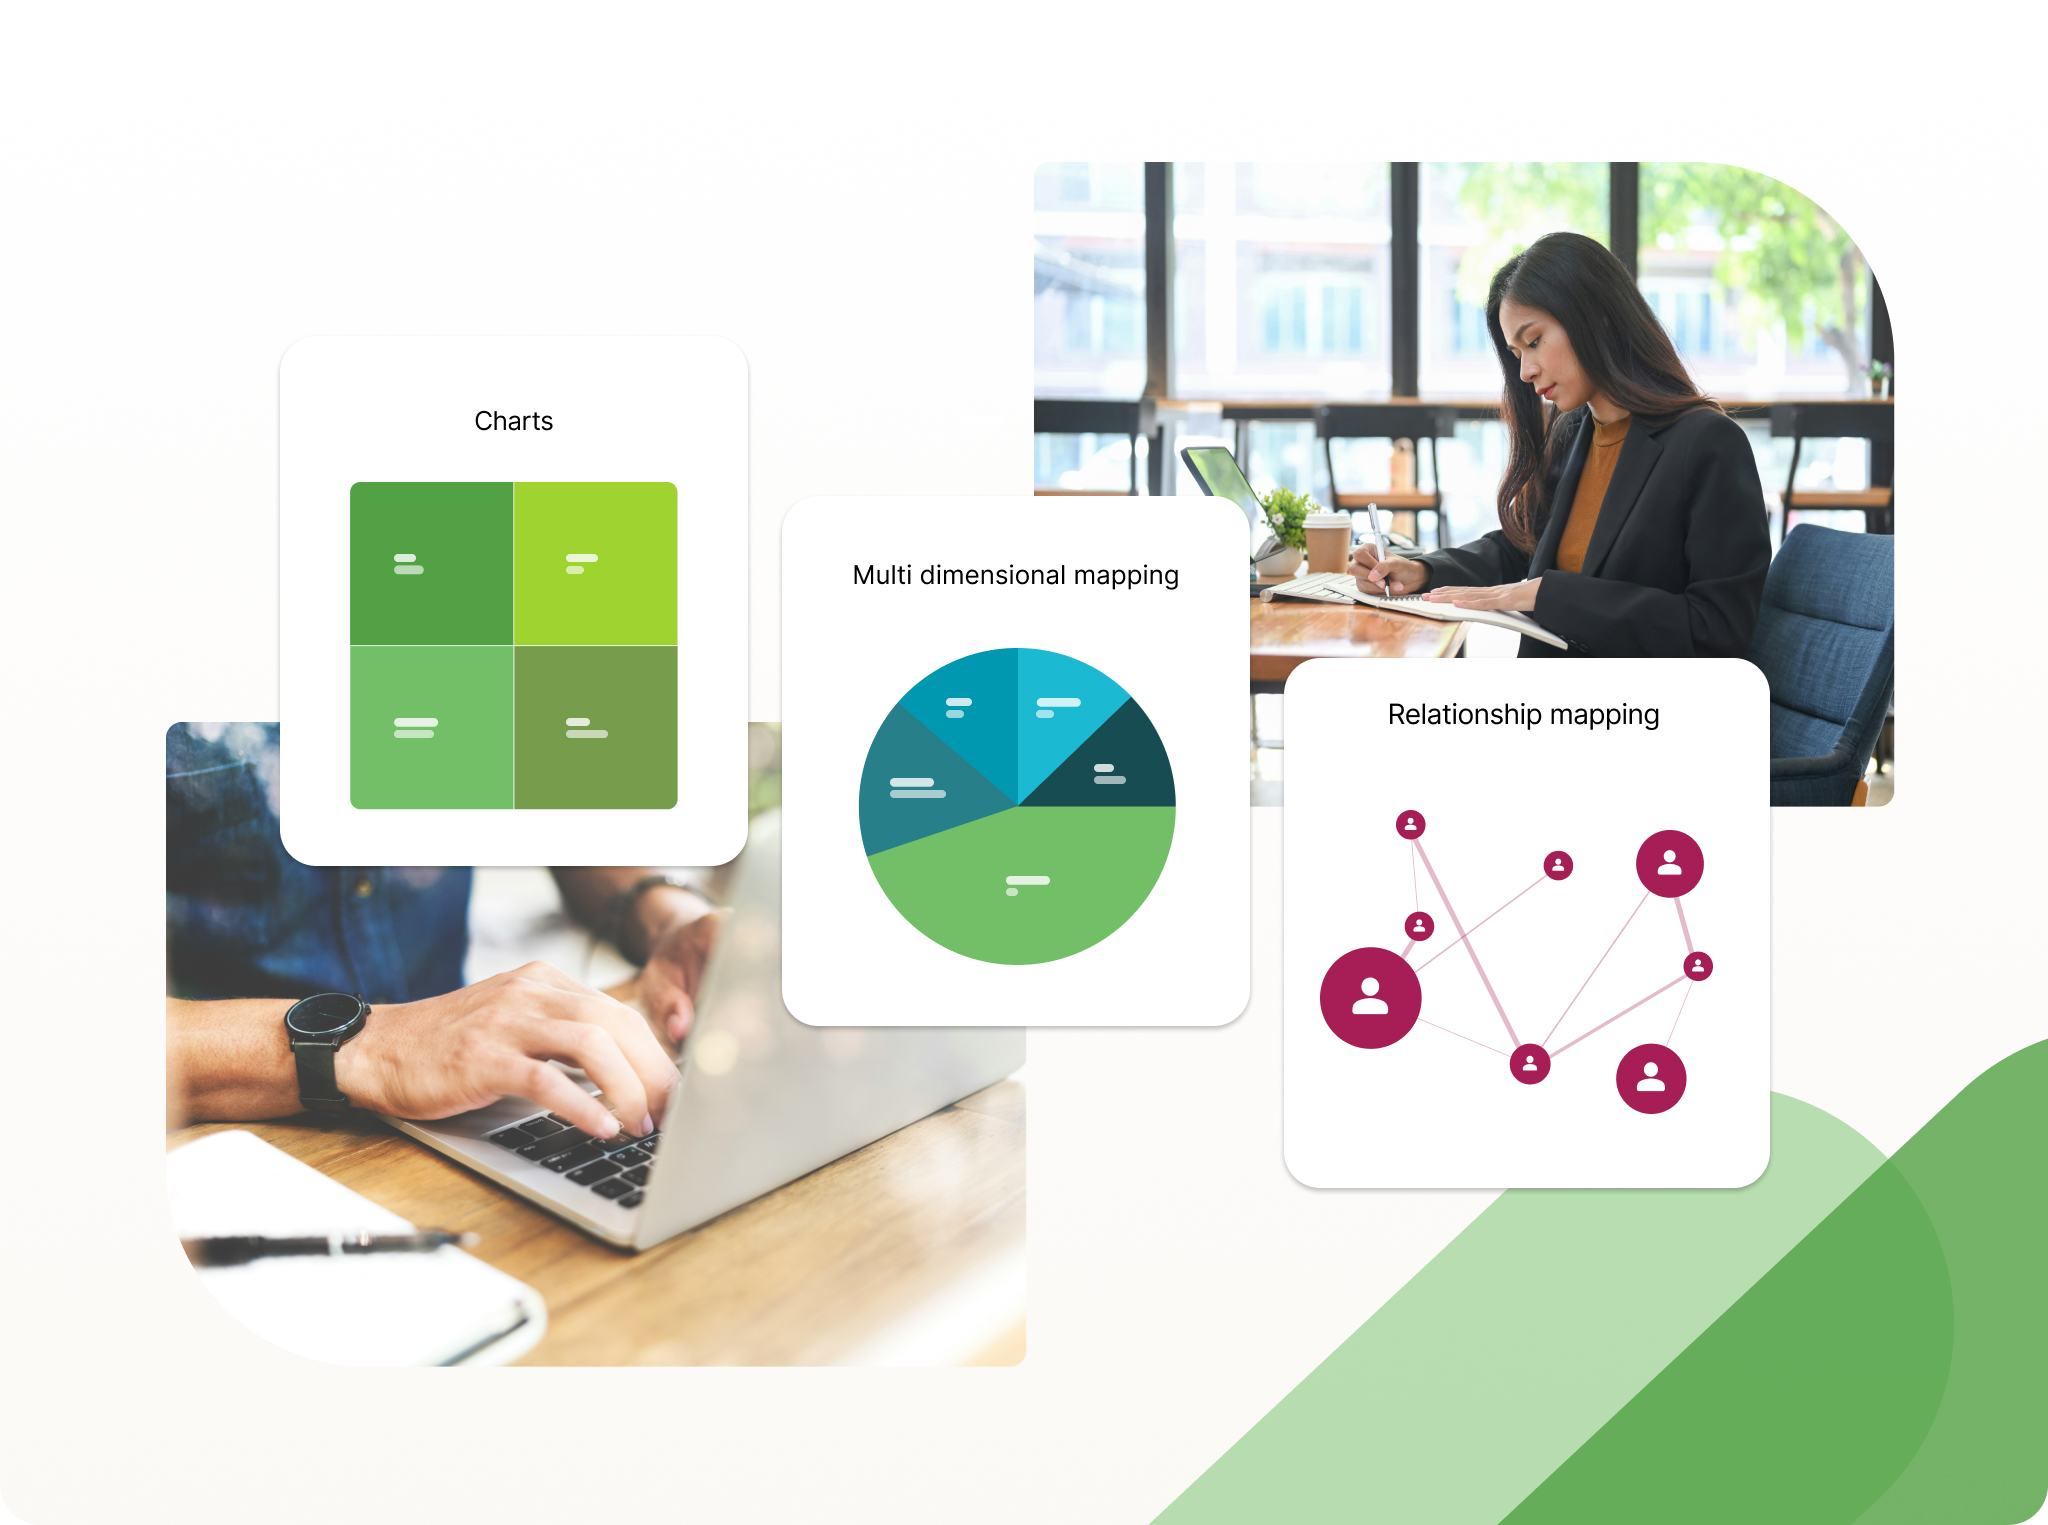
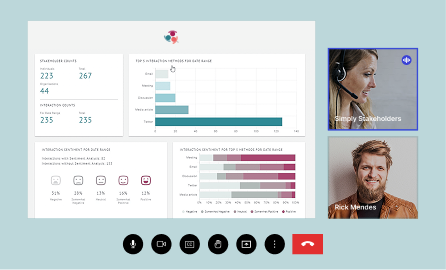
Ready to embrace a more modern, practical way to do stakeholder mapping? Simply Stakeholders offers powerful mapping capabilities, including multi-dimensional maps, relationship mapping, relationship health scores, and geographical mapping for analyzing, segmenting, and prioritizing your internal and external stakeholders.
Best of all, because our dynamic stakeholder maps are linked to your contact records, all visualizations update automatically whenever you add new stakeholders and interactions so that you can track changes over time and always have up-to-date stakeholder maps.
Discover more exciting features for managing and engaging your stakeholders or book a demo with our team.