Using a Stakeholder Matrix: 3 Practical Examples
Planning a project or stakeholder engagement and need to analyze or visualize your stakeholders quickly?
One of the tools you may want to consider is a stakeholder matrix.
In this blog, we explain what a stakeholder matrix looks like, why they’re beneficial, four steps to get started, and three examples of what using a stakeholder matrix looks like in the real world.
What is a Stakeholder Matrix?
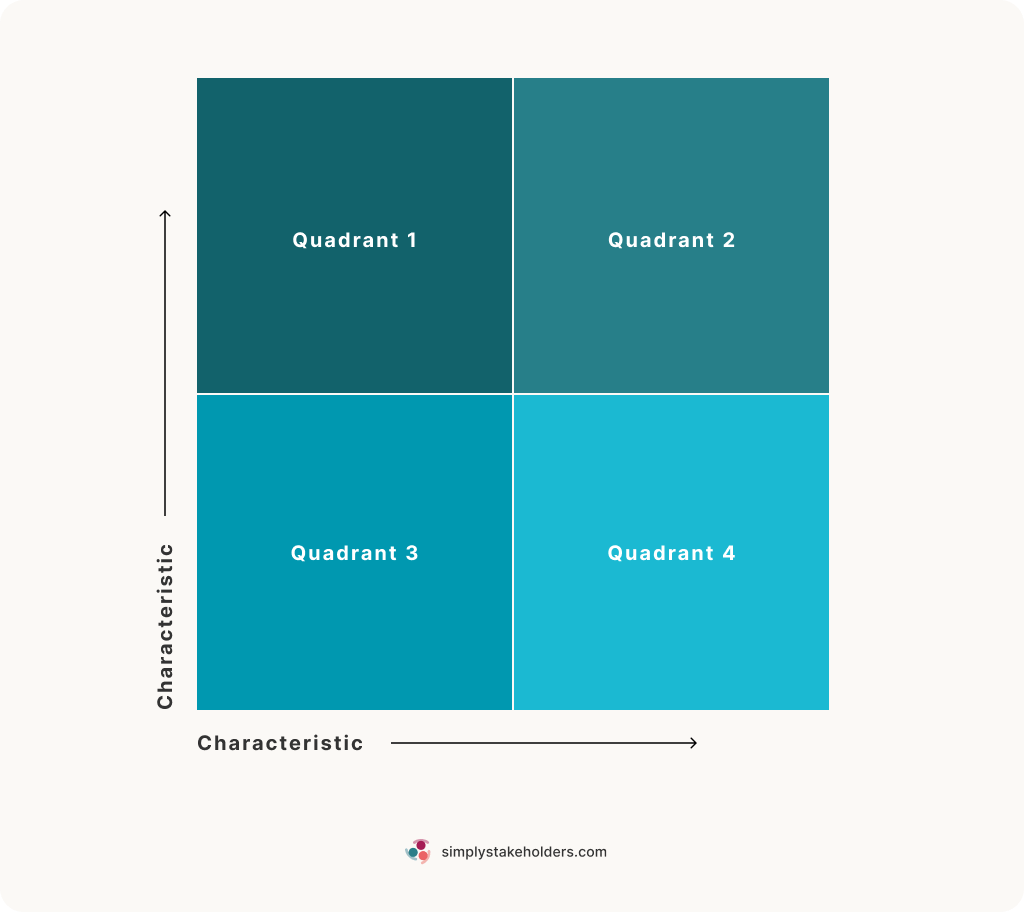
A stakeholder matrix is a type of diagram used to visualize or map stakeholders based on a particular set of characteristics.
A matrix typically shows stakeholders in a grid with four quadrants. The X-axis will be labelled with one characteristic (from low to high), and the Y-axis labelled with another (from low to high), allowing you to find a position for each stakeholder based on their level of each characteristic.
Example stakeholder characteristics you could plot on a stakeholder matrix include:
- Level of interest
- Level of impact
- Level of influence (or power)
- Level of support (or opposition)
- Level of predictability
- Level of knowledge/awareness
- Level of detail/information required
- Distance from the project
- Frequency of updates required
You won’t be able to plot all types of stakeholder characteristics — for instance, you can’t state what the interests are, where they’re located, or what organization they work for. But if you can assign a level on a linear scale (from low to high), you can probably show it on a matrix.
Why Use a Stakeholder Matrix?
Matrices are commonly used in business analysis and project management. But they can be particularly useful in stakeholder planning and management because they can help you:
- See your stakeholders at a glance, based on the characteristics that matter most to you
- Categorize your stakeholders so that you can tailor your communication type, engagement activities, or frequency
- Identify areas of potential risk or resistance that may need to be managed more closely
- Identify potential opportunities early on so you can leverage them
- Quickly identify logical actions or activities for stakeholder groups based on the quadrant they fall into
- Set priorities for managing or engaging with stakeholders
- Spot any outliers that may need a unique approach
- Communicate the strategies behind your stakeholder engagement campaign to your colleagues and leadership team
- Track progress over time, by showing a matrix pre-engagement and another matrix post-engagement
The key benefit, compared to other types of stakeholder analysis or mapping, is speed. Because the matrix is so simple, it’s a very practical tool when you’re short on time.
How to Choose and Use a Stakeholder Matrix
1. Know Your Matrix Types
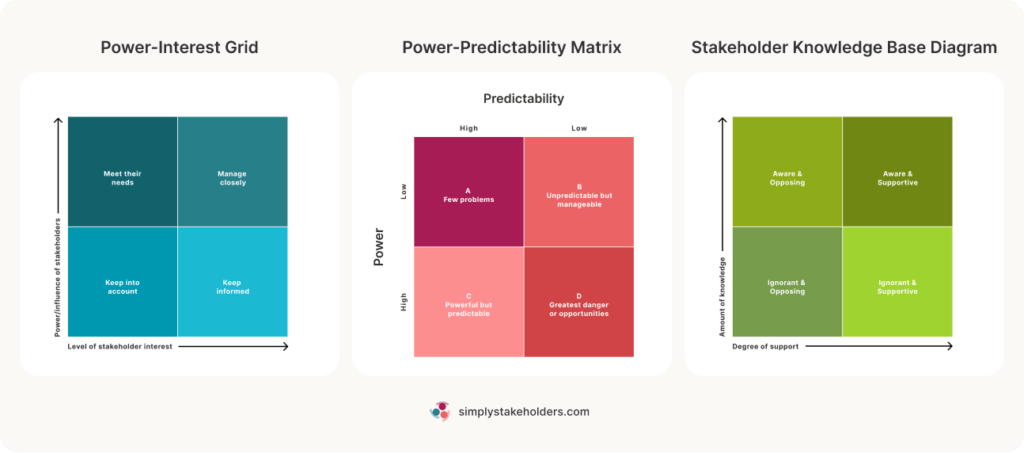
The following are commonly used stakeholder matrix frameworks:
- The Power-Interest Grid (tracks level of power/influence and level of stakeholder interest)
- The Power-Predictability Matrix (tracks the level of power and predictability)
- The Stakeholder Knowledge Base Diagram (tracks amount of knowledge and degree of support)
Each of these frameworks recommends different insights or actions, depending on which quadrant you plot a stakeholder in. For example, in the Stakeholder Knowledge Base Diagram, stakeholders with high knowledge and high support are “Aware & Supportive” and it is recommended that these stakeholders are kept informed so that they continue to support your project.
You’ll find a detailed explanation on each of these three matrices in our blog on stakeholder diagrams.
2. Determine Relevant Characteristics
Choosing the right stakeholder matrix will come down to which two characteristics are most relevant to your project, organization, and stakeholder groups. So, consider the characteristics that are most likely to be useful in categorizing or prioritizing your stakeholders for the project, and focus on these.
By the way, if those two characteristics are not represented in the above frameworks, why not create your own stakeholder matrix? Simply place one characteristic on one axis, and another characteristic on the other — and in each quadrant, note the strategy that best fits the high/low combination of both characteristics.
3. Determine Characteristic Levels
You can’t plot your stakeholders on a matrix unless you can assign them a “level” for both sets of characteristics. This may be as simple as noting whether they are low, medium, or high — or giving them a number out of 10 (for both of your chosen characteristics). You may need to lean on several data sources in order to determine your stakeholders’ levels, such as:
- Survey responses
- Interviews and conversations
- Sentiment analysis of their responses/comments
- Past experiences and interactions
- Demographic data
In some cases, you may also need to lean on your team’s assumptions until you get to know your stakeholders better.
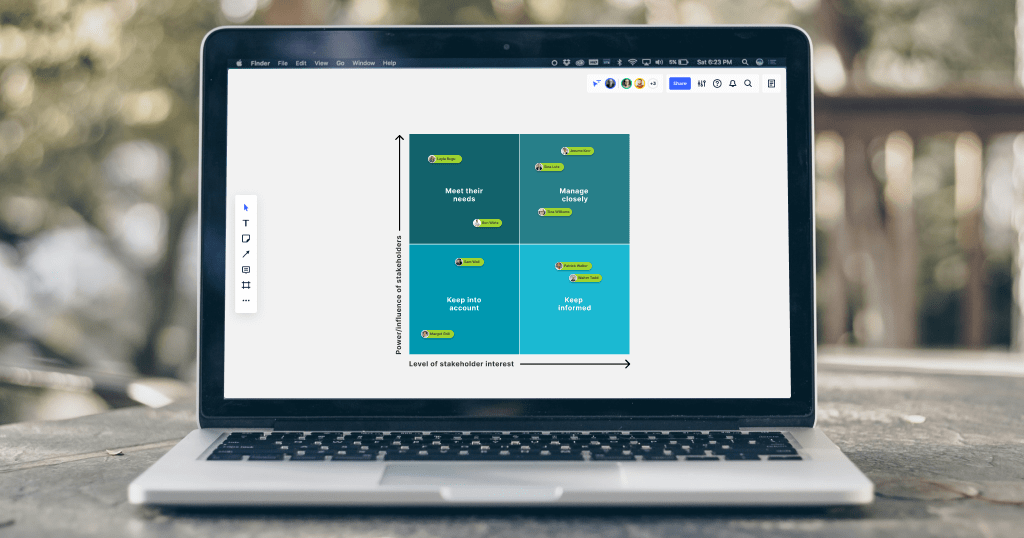
4. Plot Your Stakeholders
Now it’s time to plot your stakeholders on the matrix, according to their level at each axis. Once you’re finished, you’ll be able to see each stakeholder and how they sit in comparison with other stakeholders. And you’ll see which quadrant each stakeholder falls into, and how you might best manage or engage with them.
If you’ve got a stakeholder plan, it’s a good idea to include your stakeholder matrix with your plan for easy reference, and to add context to your recommendations.
3 Practical Examples of Using a Stakeholder Matrix
Of course, the best way to understand the value of a stakeholder matrix and how to use one is to look at some examples.
Example 1: Determining Stakeholder Involvement with Power-Interest Grid
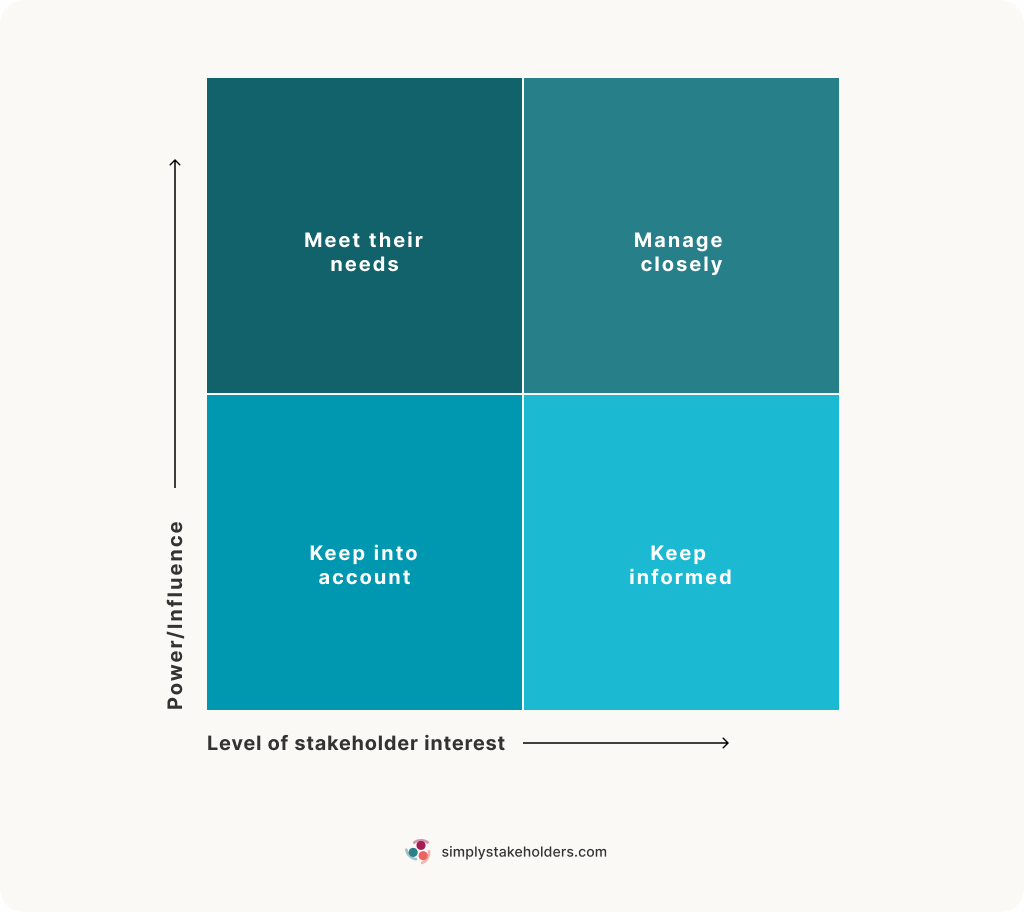
A healthcare organization used the Power-Interest Grid stakeholder matrix in order to identify which key stakeholders should be involved in planning and implementing a new electronic health records system. They mapped the following stakeholder groups based on their characteristics:
- Chief Medical Officer – High Interest/High Influence (Manage closely)
- Clinical Department Leaders – High Interest/Low Influence (Keep informed)
- Doctors & Nurses – High Interest/Low Influence (Keep informed)
- Senior Leadership – Low Interest/High Influence (Meet their needs)
- Support Staff – Low Interest/Low Influence (Keep into account)
- Software Provider – High Interest/High Influence (Manage closely)
This stakeholder matrix allows the healthcare organization to get a simple overview of their stakeholders and immediately begin planning potential engagement strategies tailored to each group.
Example 2: Assessing Stakeholders with the Power-Predictability Matrix
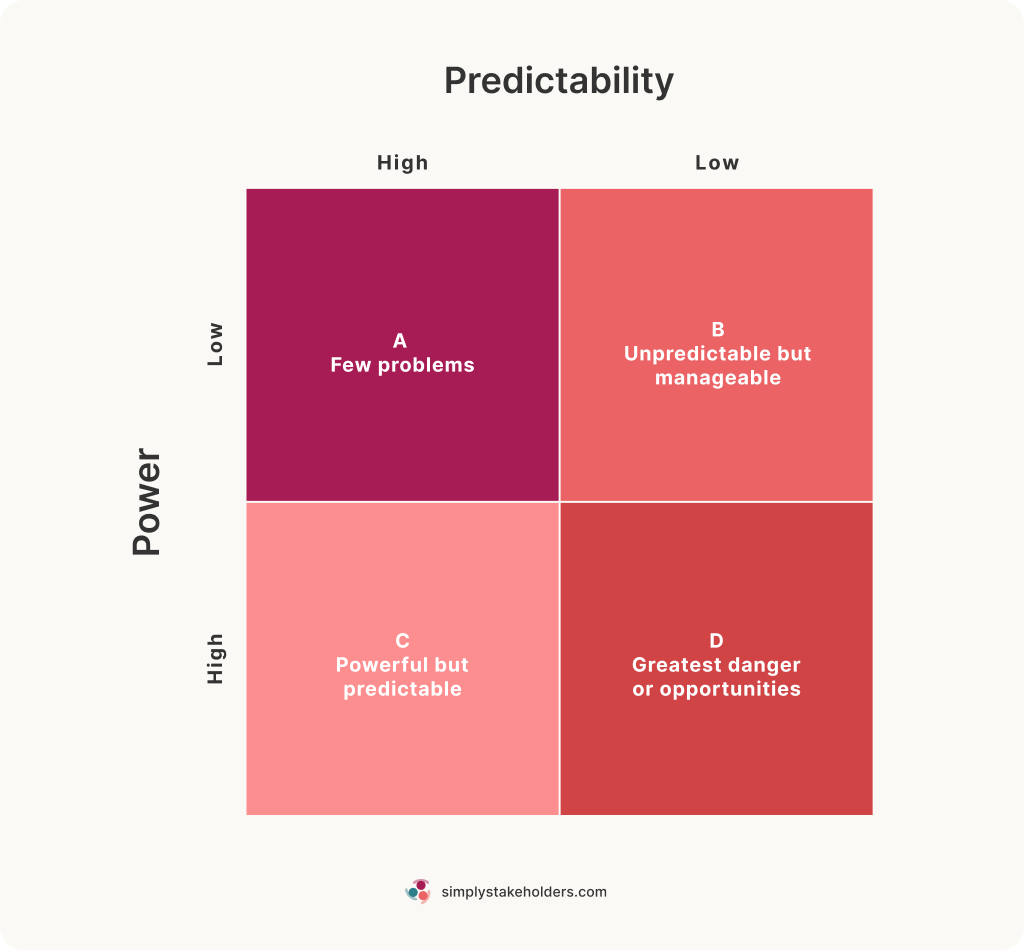
A construction company used the Power-Predictability Matrix to assess key stakeholders for a newly proposed bridge building project. They mapped the following stakeholder groups based on their characteristics:
- Local Government – High Power/Low Predictability (D: Greatest danger or opportunity)
- Project Sponsor – High Power/High Predictability (C: Powerful but predictable)
- Suppliers – Moderate Power/High Predictability (A/C: Likely few problems)
- Environmental Groups – Moderate Power/Low Predictability (B/D: Somewhat unpredictable; some danger/opportunity)
- Members of the Public – Low Power/High Predictability (A: Few problems)
By using this stakeholder matrix, the company was able to identify stakeholder groups that may need closer management or more frequent engagement in order to minimize risk and opposition to the project. For instance, they may prioritize local government engagement upfront, but choose to keep members of the public informed throughout the project (though it’s still a good idea to monitor them closely and provide opportunities for engagement and participation).
Example 3: Determining Engagement & Communication Needs with Stakeholder Knowledge Base Chart
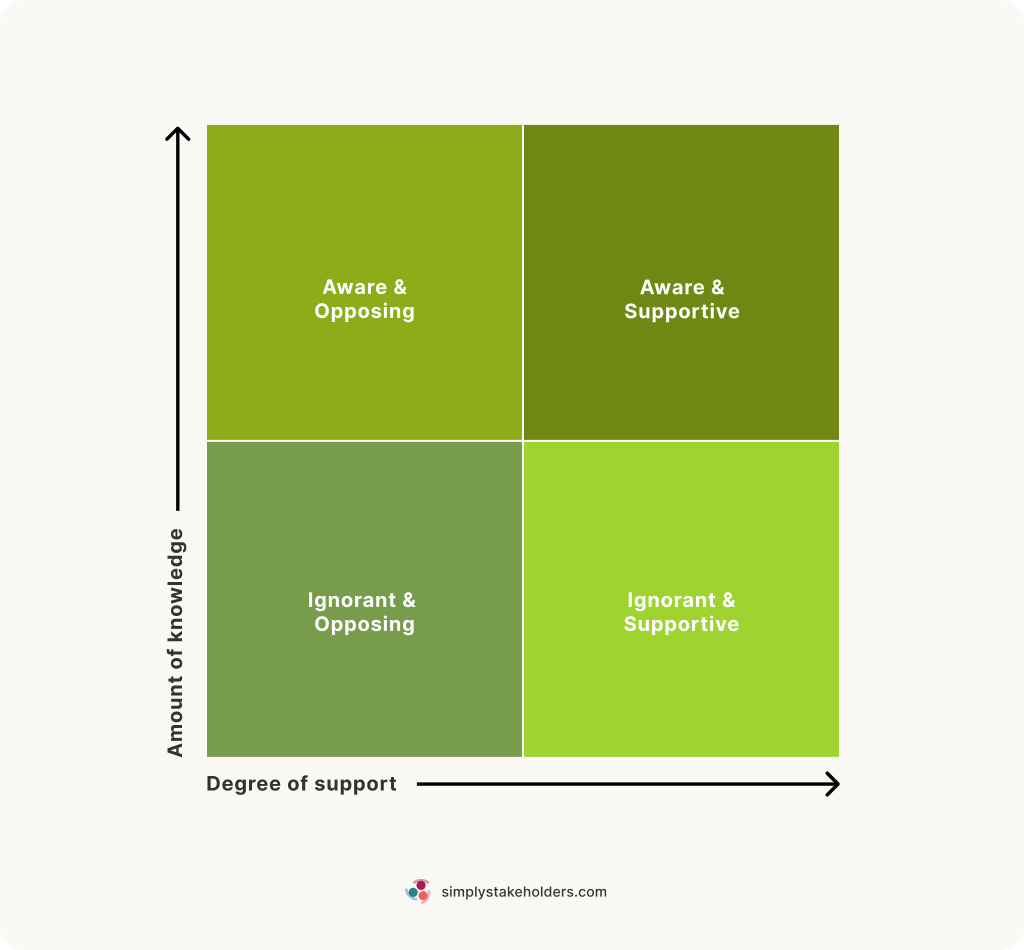
A state government organization needed to develop a new local policy on sustainable infrastructure. To help decide on their stakeholder engagement approach, they mapped key stakeholder groups and their typical characteristics using a Stakeholder Knowledge Base Chart.
- Urban Planners – High Knowledge/High Support
- Public Works Department – High Knowledge/Moderate Support
- Conservation Groups – Low Knowledge/High Support
- Local Residents – Low Knowledge/Variable Support
Based on their position on the chart, the project management team were able to begin planning the types of communications and engagement opportunities suited to each stakeholder group. They quickly determined that they’d need to engage frequently with the Urban Planners for guidance, as well as the Public Works Department for input on specific issues. They planned to engage early on with Conservation Groups to understand their concerns, educate them on the policy benefits, and develop messaging that incorporated sustainability goals. And they worked to educate the Local Residents on the policy details and its potential benefits to the community.
After some initial public consultation and engagement, the government applied their additional insights into specific stakeholder preferences, knowledge, and support to further tailor their communication and engagement approach.
Discover More Stakeholder Mapping Methods & Diagrams
One final (but important) note: you may find that your stakeholder matrix is only useful to a point — after all, it does only cover two characteristics. And, as we’ve talked about before, some of the language used in these models can be problematic.
Fortunately, there are plenty of other options to help with analyzing and visualizing your stakeholders, and we’ve covered these in detail. Check out our previous blogs:
- Stakeholder Mapping: Methods, Benefits & Examples
- 15 Stakeholder Diagrams To Add To Your Toolkit
- What is Relationship Mapping?
- Guide to Relationship Network Mapping
- Guide to Stakeholder Analysis
And if you’d like to access practical software to help you track, analyze, and map your stakeholders, why not check out Simply Stakeholders? If you’d like a demo to see for yourself, reach out to our team.