6 Stakeholder Mapping Templates [Downloadable + Editable]
Need to run some stakeholder mapping as part of your project plan, report, or stakeholder analysis? If you don’t yet have software to produce your stakeholder maps, you might like to try using a template to help with visualizing your data.
We’ve created six different types of stakeholder maps, all in .PPTX format — and each is designed to be easy to edit in either PowerPoint or Google Slides. Preview our stakeholder mapping templates below or click through to download the files. They’re completely free!
Power-Interest Grid Template
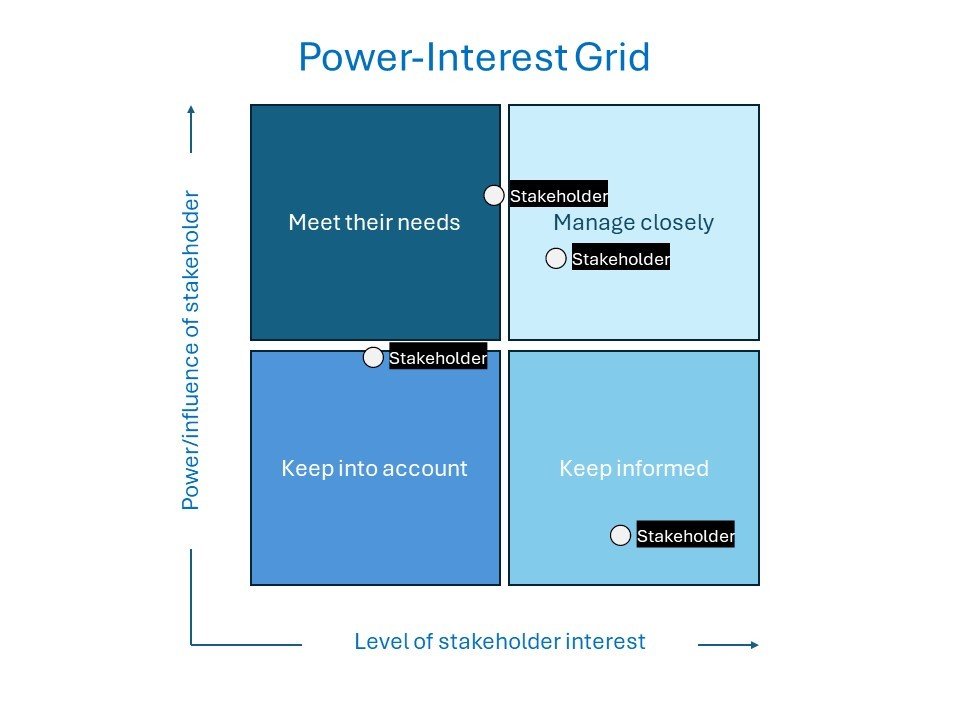
The Power-Interest Grid is a type of stakeholder matrix used to show the level of power/influence and the level of stakeholder interest. You might also hear this stakeholder mapping model referred to as the Mendelow Stakeholder Matrix.
You could use this stakeholder mapping template to map a location for each stakeholder, based on their relative levels. The idea is that the quadrant a stakeholder falls in will help to determine how you’ll engage with them. For instance, if they have high interest and high power, you’ll need to manage them closely. But if they have low interest with high power, you’ll need to meet their needs.
As we’ve mentioned in previous articles, this stakeholder mapping model has limited value for planning and analyzing your stakeholder engagements. Power isn’t easily defined these days, and the model lacks context such as stakeholder interests, support, and sentiment. But if influence and interest are key criteria for your engagement, you might still like to incorporate this diagram alongside some other types of stakeholder maps.
➡ Download the Power-Interest Grid template
Power-Predictability Matrix Template
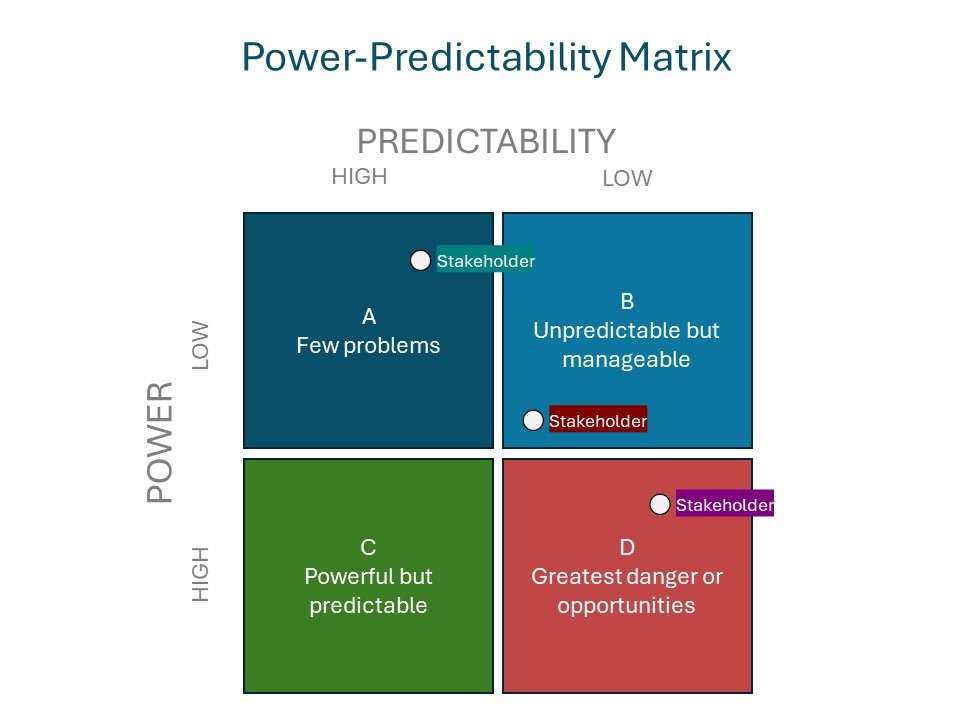
Similar to the previous model, the Power-Predictability Matrix is another type of stakeholder matrix. This one allows you to visualize stakeholders in relation to one another based on their level of power and predictability. Each of the four quadrants indicates how stakeholders may respond to your project or engagement, ranging from few problems through to greatest danger or opportunities.
We’ve included this stakeholder map template because it is popular, but if you choose to use it, we suggest including some notes on its limitations and associated issues. This model positions people as problematic, and uses dehumanizing language. And just like it’s difficult to define power, it is also tricky to predict human behavior — so it’s hard to say whether this model will provide any practical insights, compared with other types of stakeholder maps.
➡ Download the Power-Predictability Matrix template
Salience Model Template
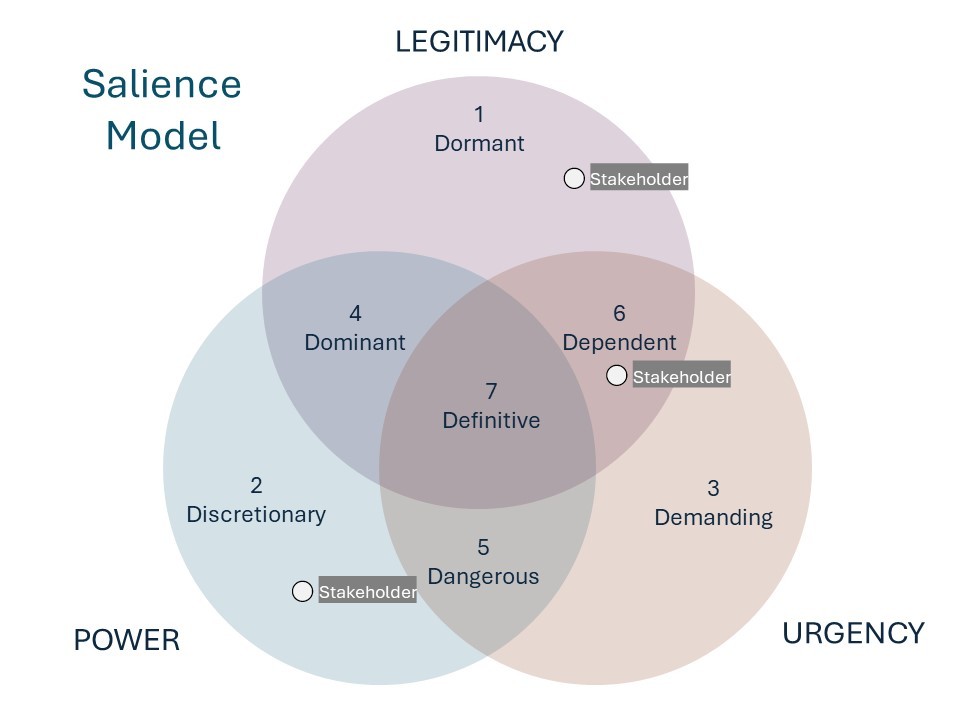
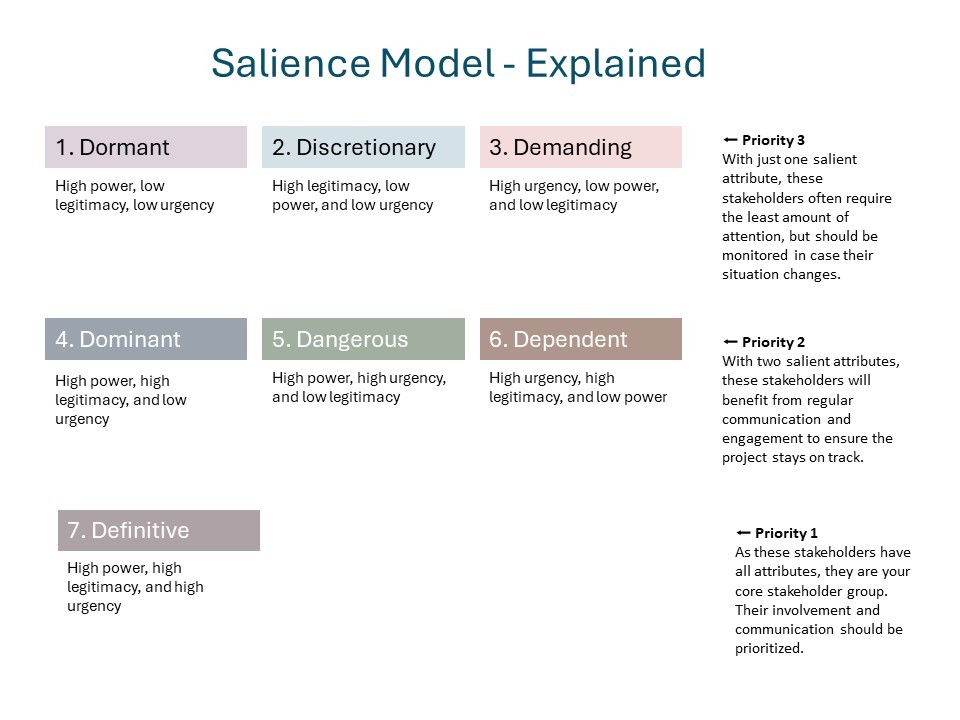
The Salience Model is a venn diagram that allows you to place stakeholders, based on their relative levels of power, legitimacy, and urgency. It includes seven potential locations: dormant, discretionary, demanding, dominant, dangerous, dependent and definitive. From there, you can determine whether someone is a priority 1, 2, or 3 stakeholder.
We’ve included an extra page with this template to help explain the different parts of the model — and how you might prioritize stakeholders according to their position.
However, like the previous stakeholder mapping templates, this model has its problems and limitations:
- It oversimplifies stakeholder attributes
- It lacks important criteria needed to genuinely prioritize stakeholders
- It doesn’t allow for neutrality (only high/low)
- It doesn’t consider the potential for power/legitimacy/urgency to shift
- Power is a problematic criteria (as we’ve already mentioned)
- The language is outdated and/or offensive (labelling people as demanding, dangerous, or dependent)
Despite this, the Salience Model remains a popular framework for stakeholder mapping. If you choose to use this template, we recommend incorporating other models alongside it — and it might be worth considering how you can adapt the language to modernize the labels.
➡ Download the Salience Model template
Stakeholder Rainbow Diagram Template
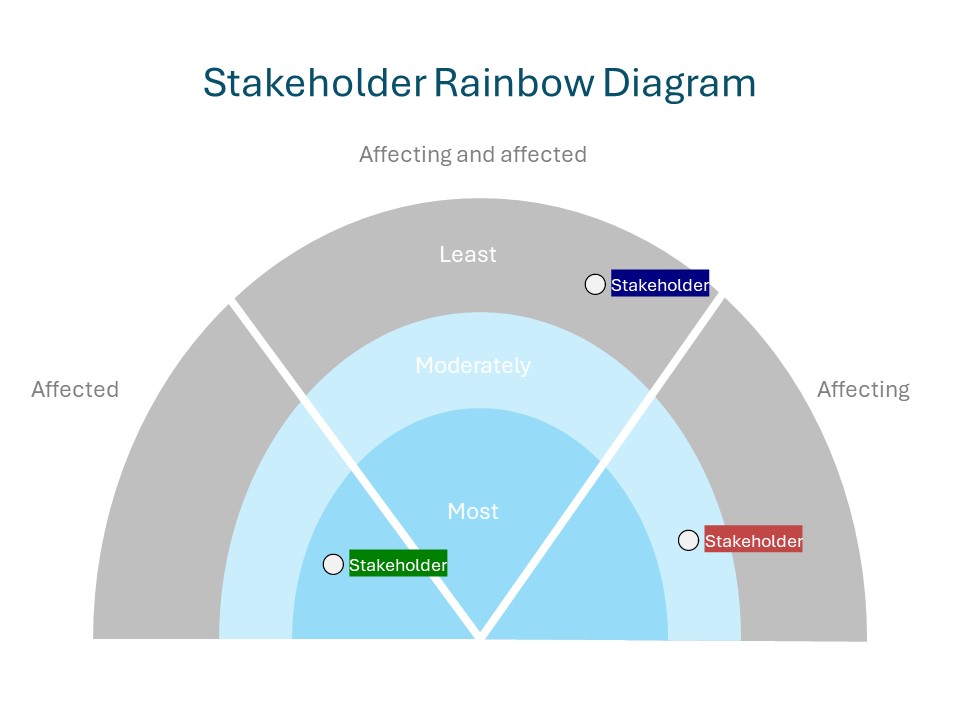
Like some of the other stakeholder mapping templates shared here, the Stakeholder Rainbow Diagram allows you to plot the location of stakeholders on a graph to visualize their characteristics in relation to one another.
This type of stakeholder map shows the degree to which you expect stakeholders to affect your project or be affected by it. The idea is that stakeholders who fall within the inner section of the rainbow will require more engagement because they’re more impacted and/or more influential. Those stakeholders in the outer section of the rainbow may require less engagement because they are less impacted and/or less influential.
The Stakeholder Rainbow Diagram is relatively simple — it doesn’t show much information and lacks other criteria that may be useful. However, this template may still prove useful for prioritizing and visualizing your stakeholders purely based on impact/influence.
➡ Download the Rainbow Diagram template
Stakeholder Relationship Network Map Template
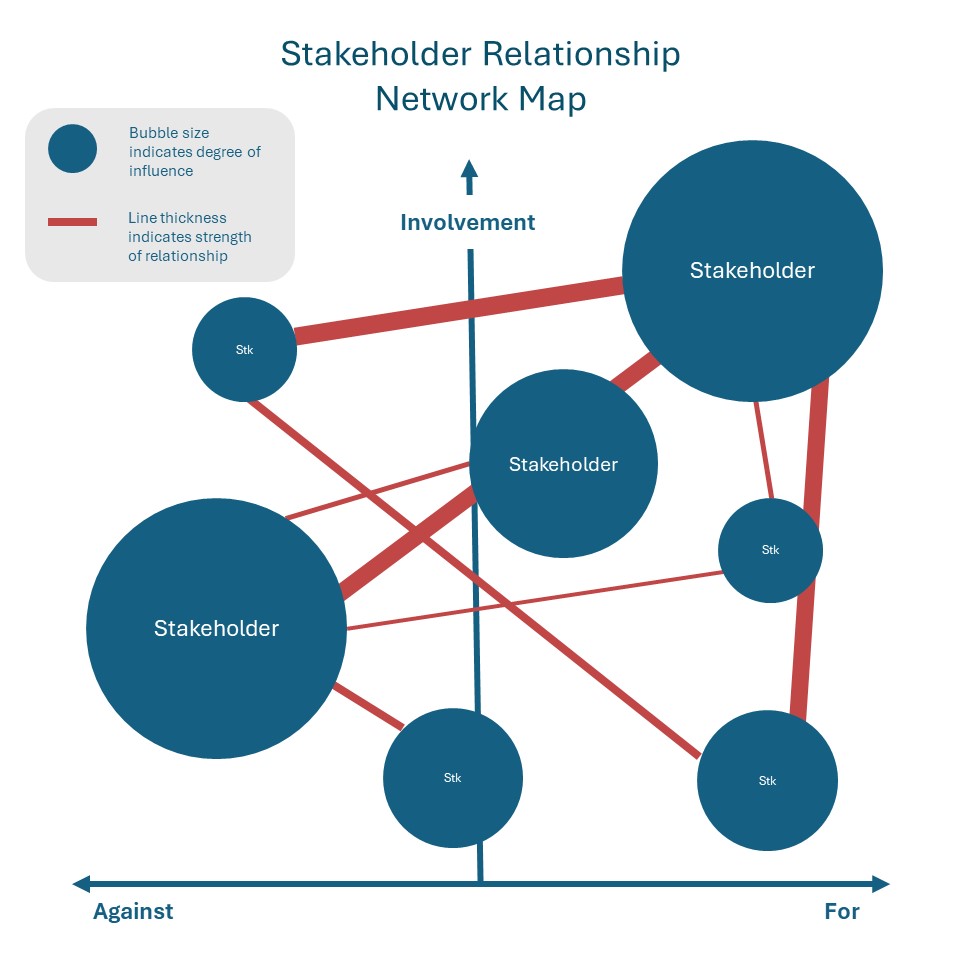
The Stakeholder Relationship Network diagram allows you to visualize the relationships between stakeholders. It can also be adjusted to show other criteria such as influence, strength of relationship, stakeholder type, direction of influence, sentiment/support, level of involvement, and more. Shape type, shape size, line thickness, colors, arrows, and other visual elements can be brought in to display extra information on stakeholders and their relationships.
Visualizing stakeholder relationships can be extremely valuable for planning and tracking your engagements. Relationship mapping can help you prioritize relationships, strategically build new relationships, and understand the (often invisible) ways your stakeholders are connected — and how this may influence their actions.
Learn more about stakeholder relationship network mapping.
This is a complex type of stakeholder map to manually create due to the various elements involved. That said, you may find our stakeholder mapping template useful if you only need to map a small number of stakeholders — and if you don’t mind moving various shapes and lines around until they reflect your stakeholder relationships!
➡ Download the Relationship Network Map template
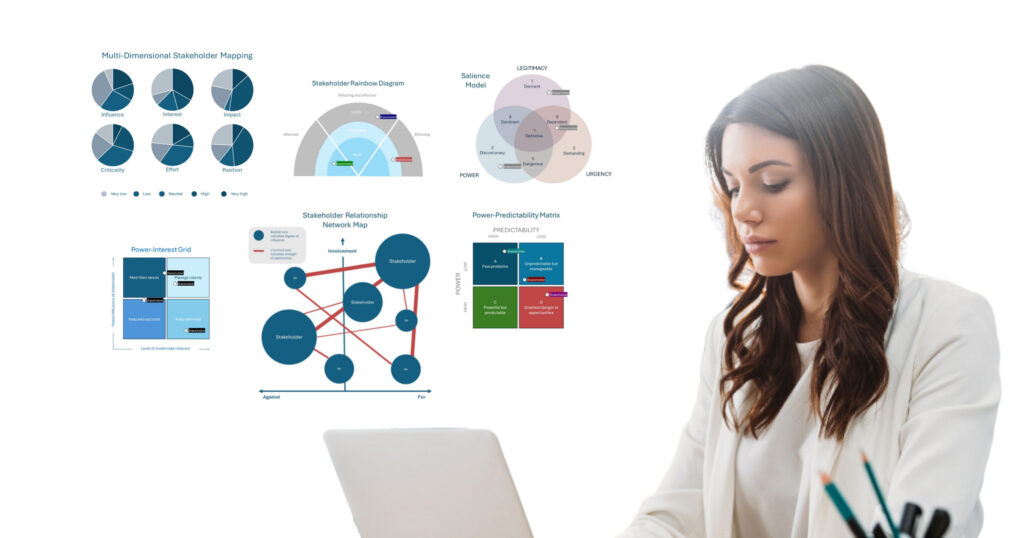
Multi-Dimensional Stakeholder Mapping Template
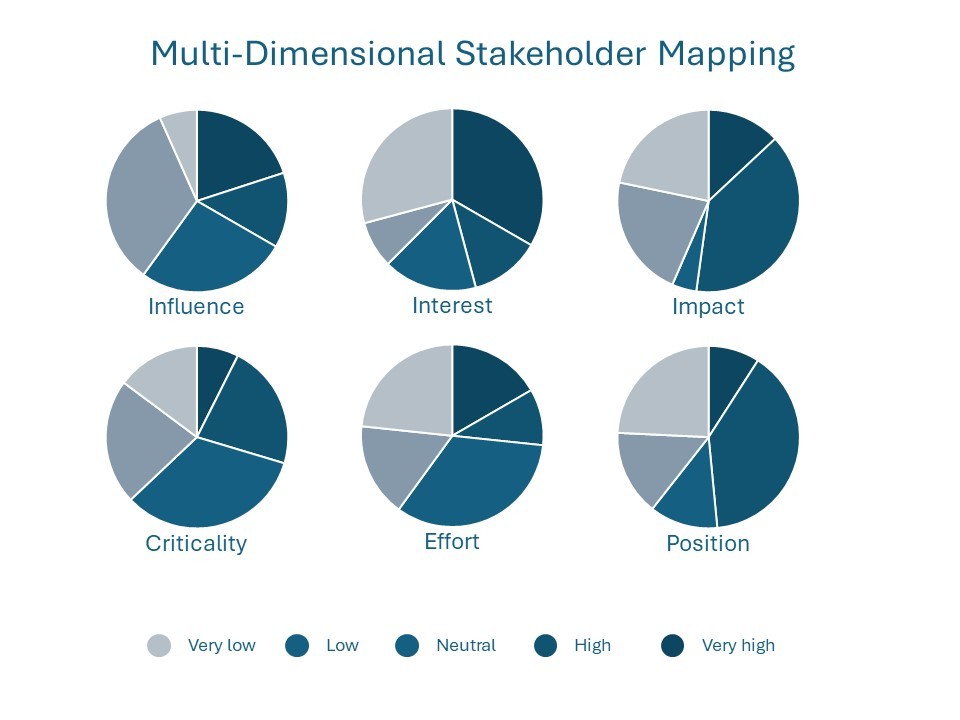
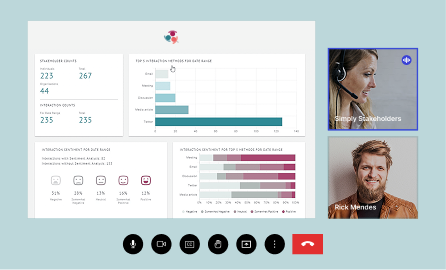
This stakeholder mapping template is based on our proprietary stakeholder mapping methodology that’s built into the Simply Stakeholders software, and it’s one our favorite methods.
Previously, we referred to this as the Three I’s Method — but we’ve actually updated the method to include not just three, but six criteria for mapping stakeholders. So, it’s probably more accurate to refer to it as Multi-Dimensional Stakeholder Mapping.
The default criteria include influence, interest, impact, criticality, effort, and position.
Inside our software, you can represent these attributes on scatter plots or stacked bar graphs, as an alternative to the pie graphs. Simply Stakeholders also allows you to customize the names of the criteria, so it’s easy to adapt the model based on what’s important for your organization or project. Most importantly, any updates to your stakeholders (e.g. an increase in influence or a decrease in position) are automatically reflected in any of your linked diagrams and maps.
We’ve recreated the methodology using pie graphs in PowerPoint so that you can adjust the maps to reflect the distribution of your stakeholders across each criteria, ranging from very low to very high.
➡ Download the Multi-Dimensional Stakeholder Mapping template
Learn More
Want to learn more? Read our previous content on stakeholder mapping or discover more stakeholder diagrams to use in your planning, reporting, and more.
Or looking for stakeholder software with built-in stakeholder mapping capabilities? Simply Stakeholders includes dynamic 3D relationship network maps and multi-dimensional stakeholder mapping — visually engaging and easy to update. Check out Simply Stakeholders, then reach out to our team if you’d like a personalized demo.